## LineGraph: Accuracy vs Model Size (Reasoner)
### Overview
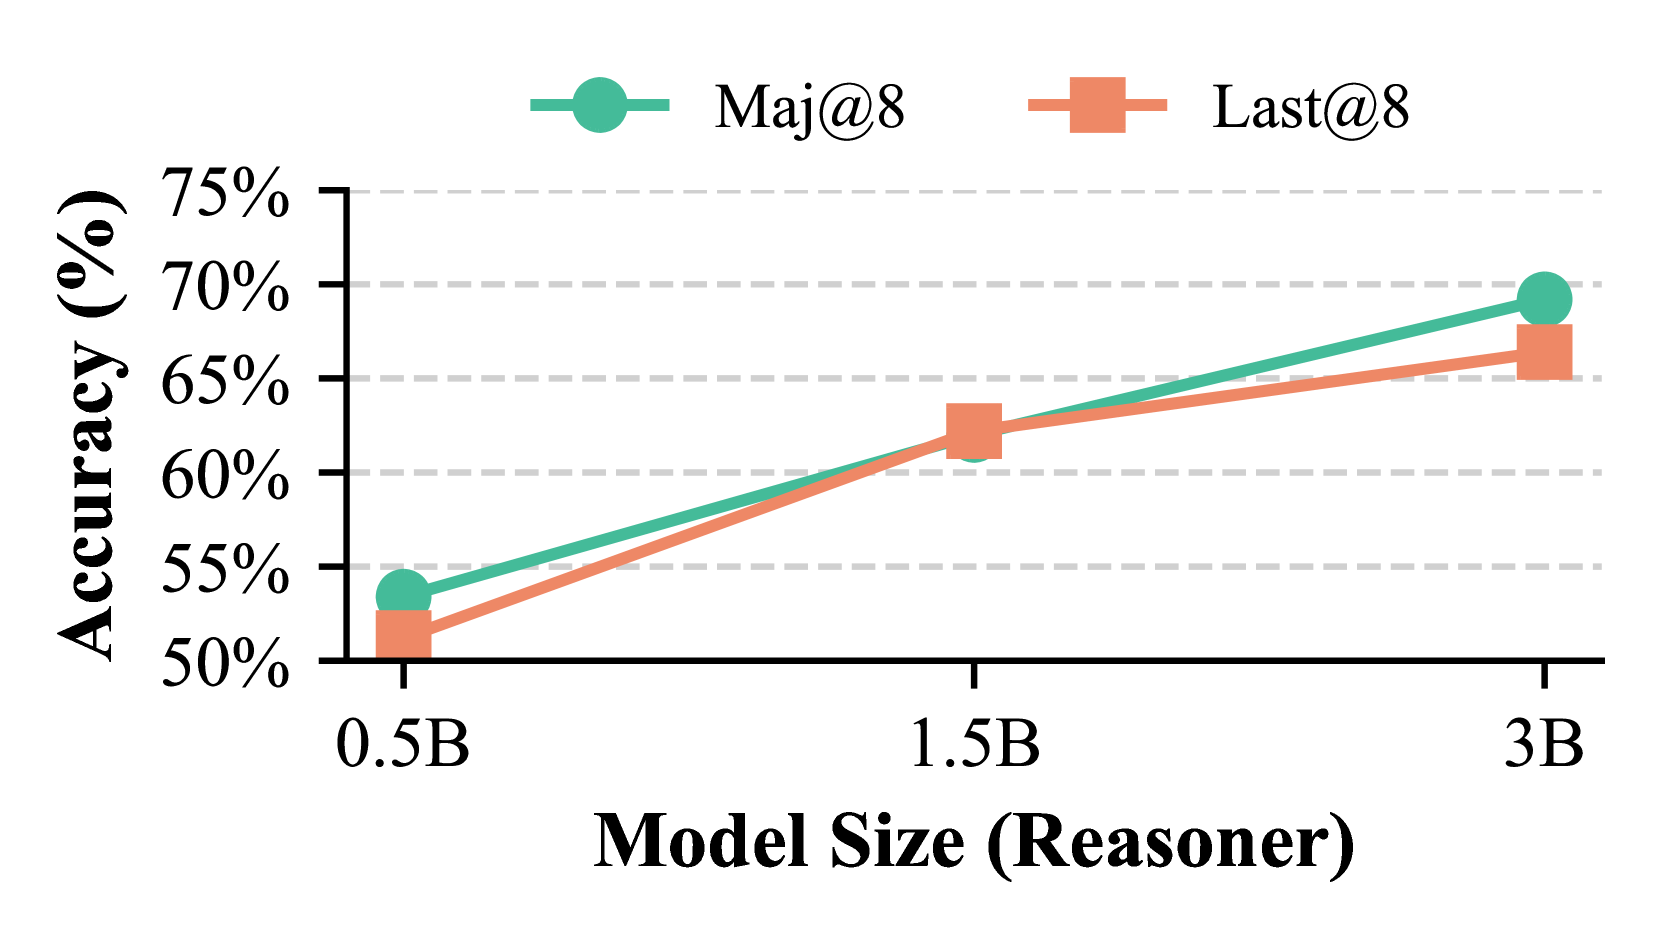
The image depicts a line graph comparing the accuracy of two evaluation metrics ("Maj@8" and "Last@8") across three model sizes (0.5B, 1.5B, and 3B parameters). Both metrics show increasing accuracy with larger model sizes, with "Maj@8" consistently outperforming "Last@8".
### Components/Axes
- **X-axis**: Model Size (Reasoner)
- Categories: 0.5B, 1.5B, 3B
- **Y-axis**: Accuracy (%)
- Scale: 50% to 75% (in 5% increments)
- **Legend**:
- Top-right corner
- "Maj@8" (teal circles)
- "Last@8" (orange squares)
- **Data Points**:
- Solid lines connect data points at each model size.
### Detailed Analysis
- **Maj@8 (Teal)**:
- 0.5B: ~54% accuracy
- 1.5B: ~62% accuracy
- 3B: ~69% accuracy
- **Last@8 (Orange)**:
- 0.5B: ~52% accuracy
- 1.5B: ~61% accuracy
- 3B: ~67% accuracy
### Key Observations
1. Both metrics show a clear upward trend as model size increases.
2. "Maj@8" outperforms "Last@8" at all model sizes, with the gap narrowing slightly at 3B (2% difference vs. 3% at 1.5B).
3. The steepest improvement occurs between 0.5B and 1.5B for both metrics.
### Interpretation
The data suggests that larger model sizes correlate with higher accuracy for both evaluation metrics. The consistent outperformance of "Maj@8" implies it may reflect a more robust or stringent evaluation framework compared to "Last@8". The diminishing gap at 3B could indicate diminishing returns in model scaling or convergence in performance between the two metrics at larger scales. This trend underscores the importance of model size in reasoning tasks while highlighting potential trade-offs between evaluation methodologies.