# Technical Document Extraction: Evolution of σₘ and ||p^(m) - p^(1)||₁
## Overview
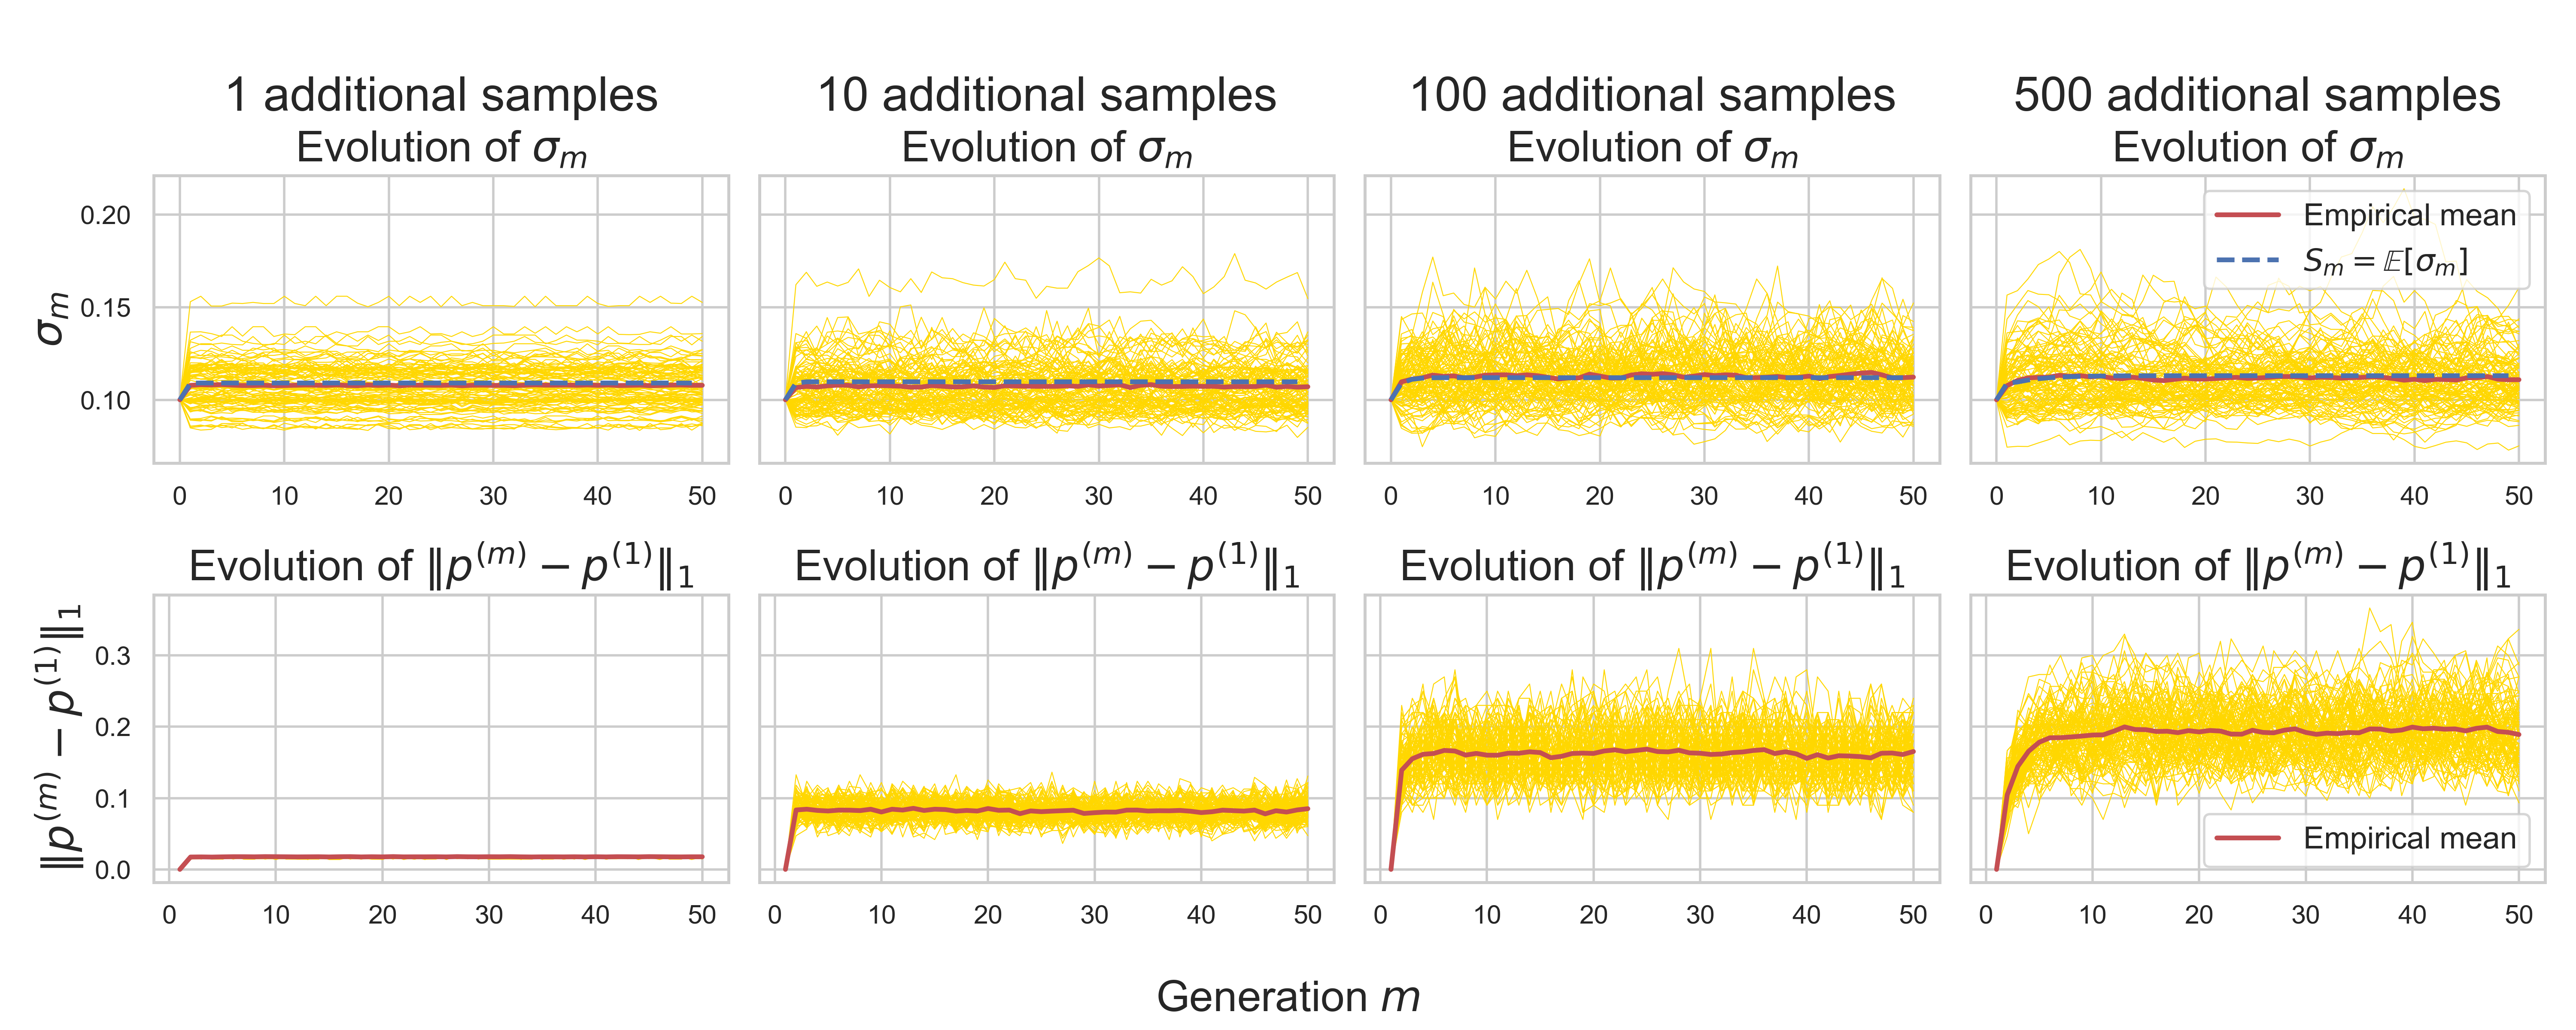
The image contains **8 line graphs** arranged in a 2x4 grid, comparing the evolution of two metrics across different sample sizes. Each row represents a distinct metric, with columns showing results for **1, 10, 100, and 500 additional samples**. Key elements include axis labels, legends, and trends in empirical means versus theoretical expectations.
---
### **Top Row: Evolution of σₘ**
#### **Graph 1: 1 Additional Sample**
- **Title**: "1 additional samples Evolution of σₘ"
- **Y-Axis**: σₘ (range: 0.10–0.20)
- **X-Axis**: Generation m (0–50)
- **Legend**:
- **Red line**: Empirical mean (stable, ~0.11)
- **Blue dashed line**: Sm = E[σₘ] (slightly higher, ~0.12)
- **Trend**:
- Empirical mean remains constant.
- Sm fluctuates moderately but stays near the empirical mean.
#### **Graph 2: 10 Additional Samples**
- **Title**: "10 additional samples Evolution of σₘ"
- **Y-Axis**: σₘ (range: 0.10–0.20)
- **X-Axis**: Generation m (0–50)
- **Legend**:
- **Red line**: Empirical mean (stable, ~0.11)
- **Blue dashed line**: Sm = E[σₘ] (slightly higher, ~0.12)
- **Trend**:
- Empirical mean remains constant.
- Sm shows reduced variability compared to 1 sample.
#### **Graph 3: 100 Additional Samples**
- **Title**: "100 additional samples Evolution of σₘ"
- **Y-Axis**: σₘ (range: 0.10–0.20)
- **X-Axis**: Generation m (0–50)
- **Legend**:
- **Red line**: Empirical mean (stable, ~0.11)
- **Blue dashed line**: Sm = E[σₘ] (slightly higher, ~0.12)
- **Trend**:
- Empirical mean remains constant.
- Sm stabilizes further, with minimal deviation from the empirical mean.
#### **Graph 4: 500 Additional Samples**
- **Title**: "500 additional samples Evolution of σₘ"
- **Y-Axis**: σₘ (range: 0.10–0.20)
- **X-Axis**: Generation m (0–50)
- **Legend**:
- **Red line**: Empirical mean (stable, ~0.11)
- **Blue dashed line**: Sm = E[σₘ] (slightly higher, ~0.12)
- **Trend**:
- Empirical mean remains constant.
- Sm converges tightly to the empirical mean, showing near-zero variability.
---
### **Bottom Row: Evolution of ||p^(m) - p^(1)||₁**
#### **Graph 1: 1 Additional Sample**
- **Title**: "Evolution of ||p^(m) - p^(1)||₁"
- **Y-Axis**: ||p^(m) - p^(1)||₁ (range: 0–0.3)
- **X-Axis**: Generation m (0–50)
- **Legend**:
- **Red line**: Empirical mean (constant at 0)
- **Trend**:
- Empirical mean remains at 0.
- Individual trials (yellow lines) show minimal deviation.
#### **Graph 2: 10 Additional Samples**
- **Title**: "Evolution of ||p^(m) - p^(1)||₁"
- **Y-Axis**: ||p^(m) - p^(1)||₁ (range: 0–0.3)
- **X-Axis**: Generation m (0–50)
- **Legend**:
- **Red line**: Empirical mean (constant at 0)
- **Trend**:
- Empirical mean remains at 0.
- Individual trials (yellow lines) cluster tightly around 0.
#### **Graph 3: 100 Additional Samples**
- **Title**: "Evolution of ||p^(m) - p^(1)||₁"
- **Y-Axis**: ||p^(m) - p^(1)||₁ (range: 0–0.3)
- **X-Axis**: Generation m (0–50)
- **Legend**:
- **Red line**: Empirical mean (constant at 0)
- **Trend**:
- Empirical mean remains at 0.
- Individual trials (yellow lines) show slight variability but stabilize near 0.
#### **Graph 4: 500 Additional Samples**
- **Title**: "Evolution of ||p^(m) - p^(1)||₁"
- **Y-Axis**: ||p^(m) - p^(1)||₁ (range: 0–0.3)
- **X-Axis**: Generation m (0–50)
- **Legend**:
- **Red line**: Empirical mean (constant at 0)
- **Trend**:
- Empirical mean remains at 0.
- Individual trials (yellow lines) exhibit significant variability but stabilize near 0.
---
### **Key Observations**
1. **σₘ Evolution**:
- The empirical mean (red) is stable across all sample sizes.
- Sm = E[σₘ] (blue dashed) converges to the empirical mean as sample size increases, indicating reduced estimation error.
2. **||p^(m) - p^(1)||₁ Evolution**:
- The empirical mean (red) remains constant at 0 for all sample sizes.
- Individual trials (yellow lines) show decreasing variability with larger sample sizes, suggesting improved convergence.
3. **Legend Placement**:
- All legends are located in the **top-right corner** of their respective graphs.
- Colors match exactly: red for empirical mean, blue dashed for Sm = E[σₘ].
4. **Spatial Grounding**:
- X-axis (Generation m) spans 0–50 for all graphs.
- Y-axis ranges differ by metric: σₘ (0.10–0.20) vs. ||p^(m) - p^(1)||₁ (0–0.3).
---
### **Conclusion**
Increasing the number of samples improves the stability of σₘ estimates (Sm converges to the empirical mean) and reduces variability in ||p^(m) - p^(1)||₁. The empirical mean remains invariant across all scenarios, while theoretical expectations (Sm) and individual trial outcomes (yellow lines) demonstrate sample-size-dependent convergence.