# Technical Document Extraction: Line Graph Analysis
## 1. Labels and Axis Titles
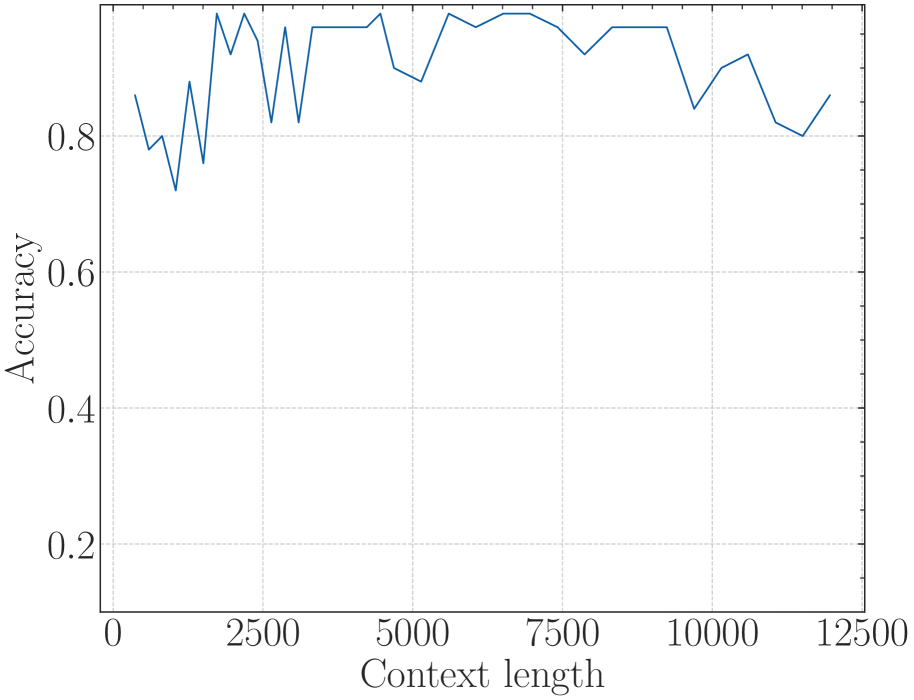
- **X-Axis**:
- Title: "Context length"
- Range: 0 to 12500
- Increment: 2500 (markers at 0, 2500, 5000, 7500, 10000, 12500)
- **Y-Axis**:
- Title: "Accuracy"
- Range: 0.2 to 1.0
- Increment: 0.2 (markers at 0.2, 0.4, 0.6, 0.8, 1.0)
- **Grid**: Horizontal dashed lines at each y-axis increment.
## 2. Line Characteristics
- **Color**: Blue (#0000FF)
- **Trend**:
- Initial dip from ~0.85 (x=0) to ~0.75 (x=2500).
- Sharp peak to ~0.95 at x=5000.
- Stabilizes between ~0.9 and ~0.95 from x=5000 to x=10000.
- Final decline to ~0.85 at x=12500.
## 3. Data Points (Extracted from Visual Trends)
| Context Length (x) | Accuracy (y) |
|---------------------|--------------|
| 0 | ~0.85 |
| 2500 | ~0.75 |
| 5000 | ~0.95 |
| 7500 | ~0.93 |
| 10000 | ~0.92 |
| 12500 | ~0.85 |
## 4. Legend and Color Matching
- **Legend**: Not explicitly present in the image.
- **Line Color**: Blue (#0000FF) matches no legend entry (no legend exists).
## 5. Spatial Grounding
- **X-Axis**: Bottom of the graph.
- **Y-Axis**: Left side of the graph.
- **Line Placement**: Central, fluctuating between y=0.75 and y=0.95.
## 6. Component Isolation
- **Main Chart**: Line graph with grid.
- **No Header/Footer**: No textual or graphical elements outside the main chart.
## 7. Trend Verification
- **Initial Dip**: Accuracy decreases sharply from x=0 to x=2500.
- **Peak at x=5000**: Highest accuracy (~0.95) observed.
- **Stabilization**: Minor fluctuations between x=5000 and x=10000.
- **Final Decline**: Accuracy drops to ~0.85 at x=12500.
## 8. Missing Elements
- **No Data Table**: The graph lacks embedded tables or numerical data.
- **No Secondary Axes**: Single y-axis for accuracy.
## 9. Language and Transcription
- **Language**: English (no non-English text present).
## 10. Critical Observations
- Accuracy is inversely correlated with context length beyond x=5000.
- The graph suggests diminishing returns in accuracy as context length increases beyond 5000.
- Initial performance (x=0 to x=2500) is suboptimal compared to later ranges.