## Chart: Runtime for solving OneMinMax
### Overview
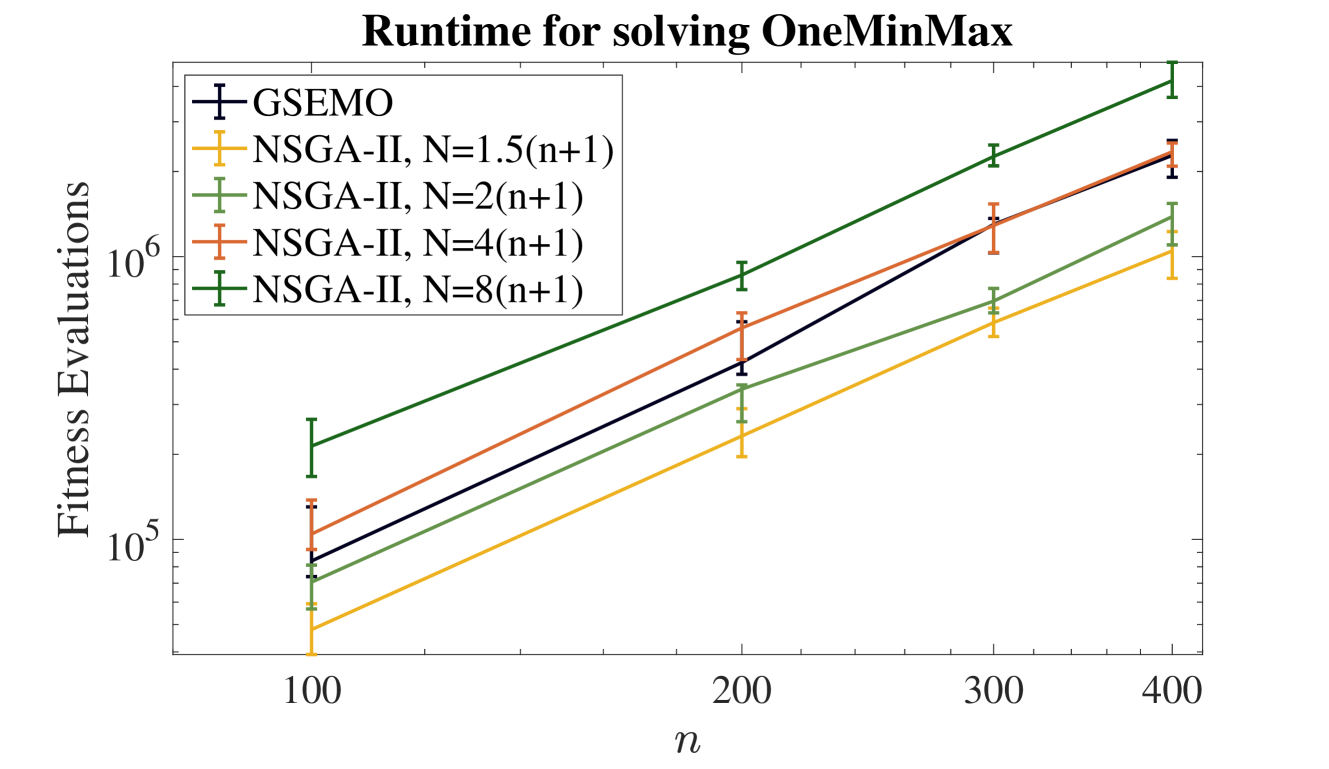
The image is a line chart comparing the runtime (measured in fitness evaluations) of different algorithms for solving the OneMinMax problem. The x-axis represents 'n', and the y-axis represents 'Fitness Evaluations' on a logarithmic scale. The chart compares the performance of GSEMO and NSGA-II with varying parameters. Error bars are present on each data point.
### Components/Axes
* **Title:** Runtime for solving OneMinMax
* **X-axis:**
* Label: n
* Scale: Linear
* Markers: 100, 200, 300, 400
* **Y-axis:**
* Label: Fitness Evaluations
* Scale: Logarithmic (base 10)
* Markers: 10^5, 10^6
* **Legend:** Located in the top-left corner.
* GSEMO (Black)
* NSGA-II, N=1.5(n+1) (Yellow)
* NSGA-II, N=2(n+1) (Light Green)
* NSGA-II, N=4(n+1) (Orange)
* NSGA-II, N=8(n+1) (Dark Green)
### Detailed Analysis
* **GSEMO (Black):**
* Trend: The line slopes upward.
* Data Points:
* n=100: Fitness Evaluations ≈ 80,000 +/- 20,000
* n=200: Fitness Evaluations ≈ 250,000 +/- 50,000
* n=300: Fitness Evaluations ≈ 1,000,000 +/- 200,000
* n=400: Fitness Evaluations ≈ 1,800,000 +/- 200,000
* **NSGA-II, N=1.5(n+1) (Yellow):**
* Trend: The line slopes upward.
* Data Points:
* n=100: Fitness Evaluations ≈ 40,000 +/- 10,000
* n=200: Fitness Evaluations ≈ 80,000 +/- 20,000
* n=300: Fitness Evaluations ≈ 400,000 +/- 100,000
* n=400: Fitness Evaluations ≈ 1,000,000 +/- 200,000
* **NSGA-II, N=2(n+1) (Light Green):**
* Trend: The line slopes upward.
* Data Points:
* n=100: Fitness Evaluations ≈ 60,000 +/- 10,000
* n=200: Fitness Evaluations ≈ 150,000 +/- 30,000
* n=300: Fitness Evaluations ≈ 500,000 +/- 100,000
* n=400: Fitness Evaluations ≈ 1,200,000 +/- 200,000
* **NSGA-II, N=4(n+1) (Orange):**
* Trend: The line slopes upward.
* Data Points:
* n=100: Fitness Evaluations ≈ 100,000 +/- 20,000
* n=200: Fitness Evaluations ≈ 300,000 +/- 50,000
* n=300: Fitness Evaluations ≈ 1,100,000 +/- 200,000
* n=400: Fitness Evaluations ≈ 1,600,000 +/- 200,000
* **NSGA-II, N=8(n+1) (Dark Green):**
* Trend: The line slopes upward.
* Data Points:
* n=100: Fitness Evaluations ≈ 80,000 +/- 20,000
* n=200: Fitness Evaluations ≈ 400,000 +/- 100,000
* n=300: Fitness Evaluations ≈ 700,000 +/- 100,000
* n=400: Fitness Evaluations ≈ 2,500,000 +/- 500,000
### Key Observations
* All algorithms show an increase in fitness evaluations as 'n' increases.
* NSGA-II with N=8(n+1) (Dark Green) generally requires the highest number of fitness evaluations.
* NSGA-II with N=1.5(n+1) (Yellow) generally requires the lowest number of fitness evaluations.
* The error bars indicate the variability in the runtime of each algorithm.
### Interpretation
The chart illustrates the performance of different algorithms in solving the OneMinMax problem. The number of fitness evaluations required to solve the problem increases with 'n' for all algorithms. The choice of algorithm and its parameters (N in NSGA-II) significantly impacts the runtime. NSGA-II with smaller N values (e.g., 1.5(n+1)) appears to be more efficient in terms of fitness evaluations compared to larger N values (e.g., 8(n+1)). GSEMO's performance is in the middle range. The error bars suggest that the runtime can vary significantly for each algorithm, indicating the stochastic nature of these optimization processes.