## Line Chart: Runtime for solving OneMinMax
### Overview
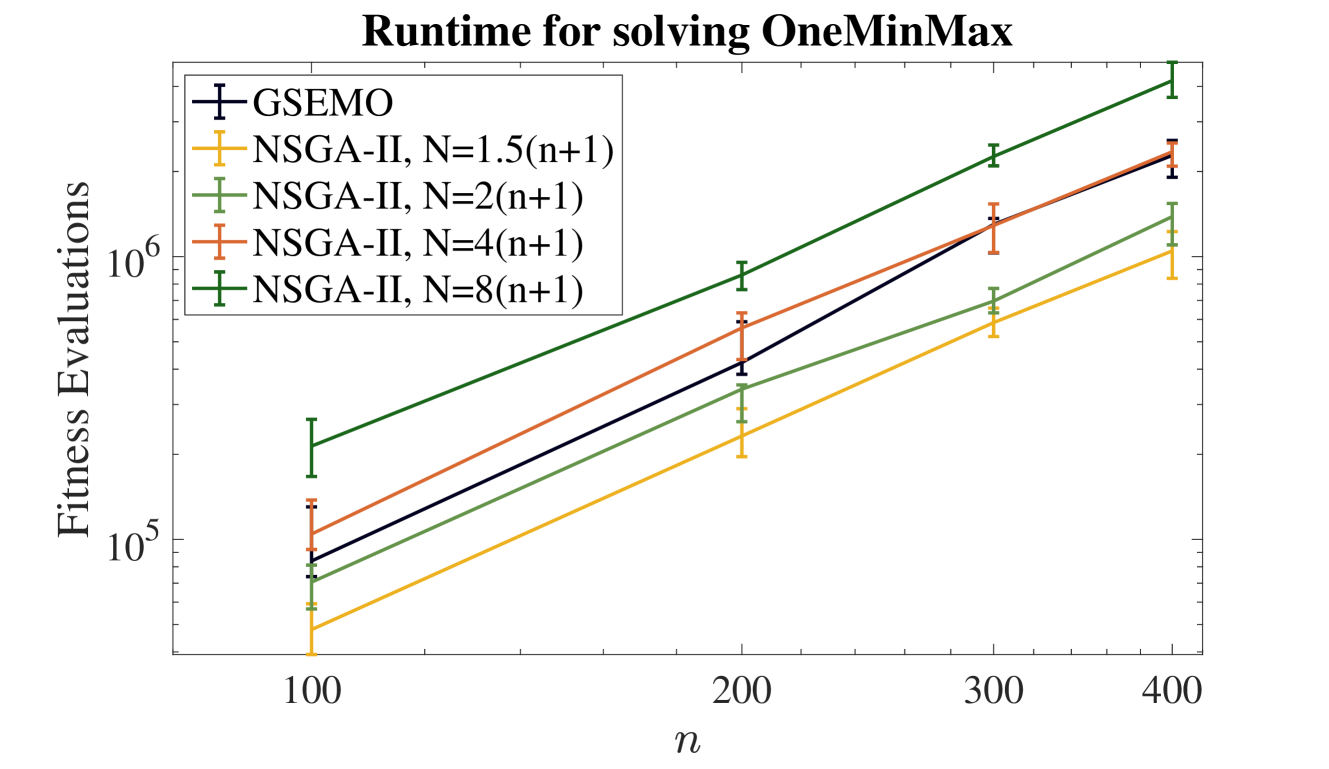
This chart displays the runtime, measured in Fitness Evaluations, for solving the OneMinMax problem using different algorithms and parameter settings. The x-axis represents the problem size 'n', and the y-axis represents the number of Fitness Evaluations on a logarithmic scale. Error bars are included for each data series, indicating the variability in runtime.
### Components/Axes
* **Title:** "Runtime for solving OneMinMax" (positioned at the top-center)
* **X-axis Label:** "n" (positioned at the bottom-center)
* **Y-axis Label:** "Fitness Evaluations" (positioned vertically along the left side) - Logarithmic scale.
* **Legend:** Located at the top-right corner of the chart.
* GSEMO (Black)
* NSGA-II (Orange)
* NSGA-II, N=1.5(n+1) (Light Green)
* NSGA-II, N=2(n+1) (Red)
* NSGA-II, N=4(n+1) (Magenta)
* NSGA-II, N=8(n+1) (Dark Green)
### Detailed Analysis
The chart shows six data series, each representing a different algorithm or parameter configuration. All lines exhibit an upward trend, indicating that runtime increases with problem size 'n'. The error bars show the variance in runtime for each configuration.
* **GSEMO (Black):** The line slopes upward consistently.
* At n ≈ 100, Fitness Evaluations ≈ 2.5 x 10<sup>5</sup>, with an error bar extending from approximately 1.5 x 10<sup>5</sup> to 3.5 x 10<sup>5</sup>.
* At n ≈ 400, Fitness Evaluations ≈ 8.0 x 10<sup>5</sup>, with an error bar extending from approximately 6.0 x 10<sup>5</sup> to 1.0 x 10<sup>6</sup>.
* **NSGA-II (Orange):** The line slopes upward consistently.
* At n ≈ 100, Fitness Evaluations ≈ 3.0 x 10<sup>5</sup>, with an error bar extending from approximately 2.0 x 10<sup>5</sup> to 4.0 x 10<sup>5</sup>.
* At n ≈ 400, Fitness Evaluations ≈ 9.0 x 10<sup>5</sup>, with an error bar extending from approximately 7.0 x 10<sup>5</sup> to 1.1 x 10<sup>6</sup>.
* **NSGA-II, N=1.5(n+1) (Light Green):** The line slopes upward consistently.
* At n ≈ 100, Fitness Evaluations ≈ 1.5 x 10<sup>5</sup>, with an error bar extending from approximately 1.0 x 10<sup>5</sup> to 2.0 x 10<sup>5</sup>.
* At n ≈ 400, Fitness Evaluations ≈ 5.0 x 10<sup>5</sup>, with an error bar extending from approximately 4.0 x 10<sup>5</sup> to 6.0 x 10<sup>5</sup>.
* **NSGA-II, N=2(n+1) (Red):** The line slopes upward consistently.
* At n ≈ 100, Fitness Evaluations ≈ 2.0 x 10<sup>5</sup>, with an error bar extending from approximately 1.5 x 10<sup>5</sup> to 2.5 x 10<sup>5</sup>.
* At n ≈ 400, Fitness Evaluations ≈ 7.0 x 10<sup>5</sup>, with an error bar extending from approximately 5.0 x 10<sup>5</sup> to 9.0 x 10<sup>5</sup>.
* **NSGA-II, N=4(n+1) (Magenta):** The line slopes upward consistently.
* At n ≈ 100, Fitness Evaluations ≈ 3.0 x 10<sup>5</sup>, with an error bar extending from approximately 2.0 x 10<sup>5</sup> to 4.0 x 10<sup>5</sup>.
* At n ≈ 400, Fitness Evaluations ≈ 1.0 x 10<sup>6</sup>, with an error bar extending from approximately 8.0 x 10<sup>5</sup> to 1.2 x 10<sup>6</sup>.
* **NSGA-II, N=8(n+1) (Dark Green):** The line slopes upward consistently.
* At n ≈ 100, Fitness Evaluations ≈ 1.0 x 10<sup>5</sup>, with an error bar extending from approximately 7.0 x 10<sup>4</sup> to 1.3 x 10<sup>5</sup>.
* At n ≈ 400, Fitness Evaluations ≈ 6.0 x 10<sup>5</sup>, with an error bar extending from approximately 5.0 x 10<sup>5</sup> to 7.0 x 10<sup>5</sup>.
### Key Observations
* The NSGA-II algorithm with N=1.5(n+1) consistently exhibits the lowest runtime across all tested values of 'n'.
* The GSEMO algorithm generally performs worse than NSGA-II, with higher fitness evaluation counts.
* As 'n' increases, the error bars tend to widen, suggesting greater variability in runtime for larger problem sizes.
* NSGA-II with N=8(n+1) and N=4(n+1) show the highest runtimes at n=400.
### Interpretation
The chart demonstrates the scalability of different algorithms for solving the OneMinMax problem. The results suggest that NSGA-II, particularly with the parameter setting N=1.5(n+1), is the most efficient algorithm for this problem, requiring the fewest fitness evaluations to reach a solution. The logarithmic scale of the y-axis highlights the exponential growth in runtime as the problem size increases. The error bars indicate that the runtime can vary significantly, even for the same algorithm and problem size, potentially due to factors such as random initialization or the inherent stochasticity of the algorithms. The widening error bars with increasing 'n' suggest that the runtime becomes more unpredictable as the problem becomes more complex. The data suggests a polynomial relationship between problem size and runtime for all algorithms tested. The choice of 'N' parameter in NSGA-II significantly impacts performance, with N=1.5(n+1) being optimal in this case.