## Line Chart: Runtime for solving OneMinMax
### Overview
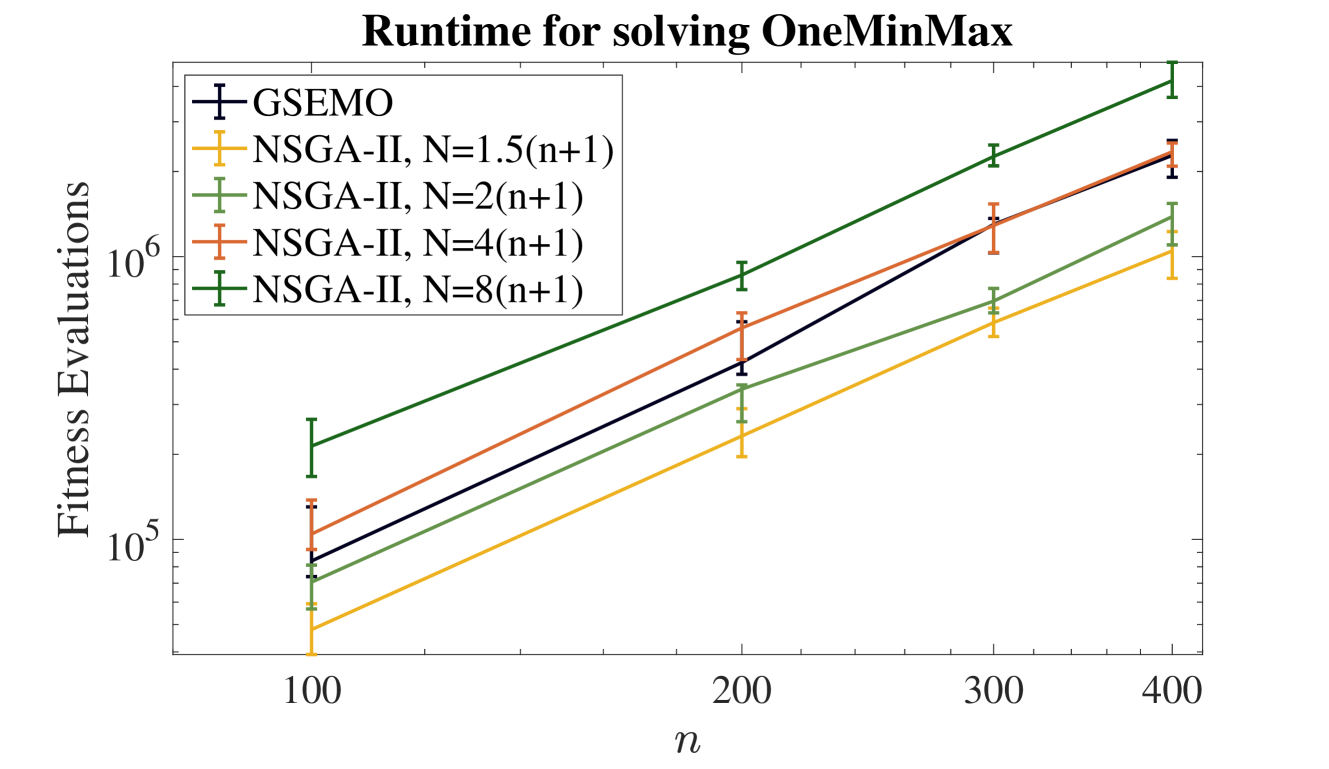
The chart compares the runtime (measured in fitness evaluations) of five optimization algorithms (GSEMO and NSGA-II variants) as a function of problem size `n` (ranging from 100 to 400). The y-axis uses a logarithmic scale (10⁵ to 10⁷) to accommodate exponential growth trends.
### Components/Axes
- **X-axis**: `n` (problem size), labeled with ticks at 100, 200, 300, 400.
- **Y-axis**: "Fitness Evaluations" (log scale, 10⁵ to 10⁷).
- **Legend**: Located in the top-left corner, with five entries:
- **GSEMO** (dark blue, cross markers)
- **NSGA-II, N=1.5(n+1)** (orange, plus markers)
- **NSGA-II, N=2(n+1)** (green, plus markers)
- **NSGA-II, N=4(n+1)** (red, plus markers)
- **NSGA-II, N=8(n+1)** (dark green, plus markers)
### Detailed Analysis
1. **GSEMO** (dark blue):
- At `n=100`: ~8×10⁴ evaluations.
- At `n=200`: ~3×10⁵ evaluations.
- At `n=300`: ~1.2×10⁶ evaluations.
- At `n=400`: ~2.5×10⁶ evaluations.
- **Trend**: Linear increase on the log scale (exponential growth in raw values).
2. **NSGA-II, N=1.5(n+1)** (orange):
- At `n=100`: ~5×10⁴ evaluations.
- At `n=200`: ~1.5×10⁵ evaluations.
- At `n=300`: ~5×10⁵ evaluations.
- At `n=400`: ~1.2×10⁶ evaluations.
- **Trend**: Slightly steeper than GSEMO but less than higher-N NSGA-II variants.
3. **NSGA-II, N=2(n+1)** (green):
- At `n=100`: ~7×10⁴ evaluations.
- At `n=200`: ~2×10⁵ evaluations.
- At `n=300`: ~8×10⁵ evaluations.
- At `n=400`: ~2×10⁶ evaluations.
- **Trend**: Intermediate growth rate between GSEMO and higher-N NSGA-II.
4. **NSGA-II, N=4(n+1)** (red):
- At `n=100`: ~1×10⁵ evaluations.
- At `n=200`: ~5×10⁵ evaluations.
- At `n=300`: ~1.5×10⁶ evaluations.
- At `n=400`: ~3×10⁶ evaluations.
- **Trend**: Steeper than GSEMO and N=2 NSGA-II.
5. **NSGA-II, N=8(n+1)** (dark green):
- At `n=100`: ~1.5×10⁵ evaluations.
- At `n=200`: ~1×10⁶ evaluations.
- At `n=300`: ~3×10⁶ evaluations.
- At `n=400`: ~6×10⁶ evaluations.
- **Trend**: Steepest slope, indicating the highest computational cost.
### Key Observations
- **Scalability**: All algorithms exhibit exponential growth in runtime as `n` increases, but NSGA-II with larger `N` values scales poorly.
- **GSEMO vs. NSGA-II**: GSEMO consistently outperforms NSGA-II with `N=1.5(n+1)` but is outperformed by NSGA-II with `N≥2(n+1)`.
- **Error Bars**: Small vertical error bars (e.g., ±10⁴ at `n=100`) suggest low variability in evaluations across runs.
### Interpretation
The data demonstrates that **NSGA-II with larger `N` values (e.g., 8(n+1))** has the highest runtime, likely due to increased population diversity or computational overhead. **GSEMO** offers a middle-ground performance, suggesting it may be more efficient than NSGA-II for moderate `N` values but less scalable than NSGA-II with smaller `N`. The logarithmic y-axis highlights the exponential nature of the problem, emphasizing the need for algorithm selection based on problem size and resource constraints. Notably, NSGA-II with `N=8(n+1)` doubles its runtime between `n=200` and `n=400`, indicating severe scalability issues for large-scale problems.