# Technical Analysis of Control Value Over Time
## Chart Overview
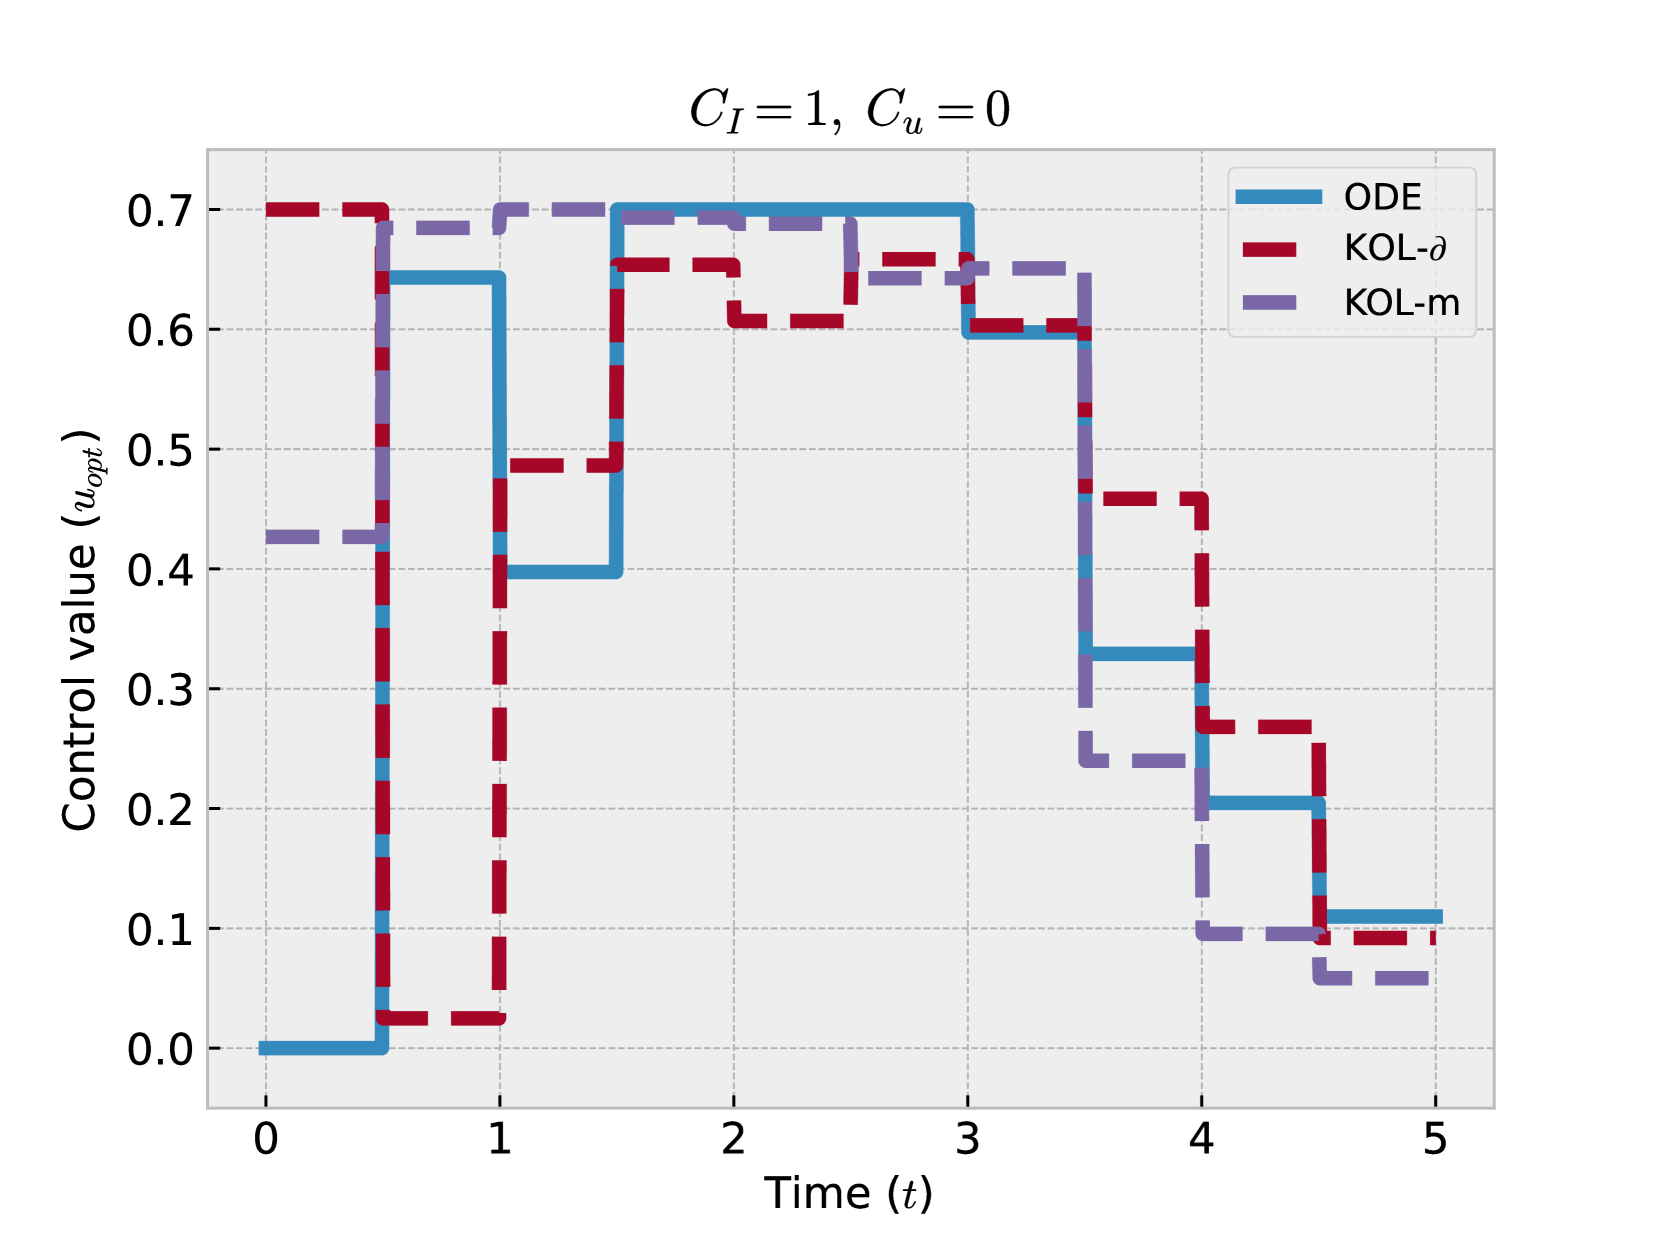
The image depicts a step-plot chart illustrating the behavior of three control strategies over time. The chart is titled with system parameters:
**C_I = 1, C_u = 0**
---
## Axes and Labels
- **X-axis (Time, t):**
- Range: 0 to 5 (discrete intervals)
- Units: Dimensionless time steps
- **Y-axis (Control value, u_opt):**
- Range: 0.0 to 0.7
- Units: Dimensionless control value
---
## Legend and Control Strategies
The chart compares three control strategies, differentiated by line style and color:
1. **ODE** (Solid blue line)
2. **KOL-δ** (Dashed red line)
3. **KOL-m** (Dotted purple line)
---
## Key Data Trends
### ODE (Solid Blue)
- **t = 0 → 1:** Control value remains at **0.0**.
- **t = 1 → 3:** Control value steps up to **0.7** and remains constant.
- **t = 3 → 4:** Control value drops to **0.1** and remains constant.
- **t = 4 → 5:** Control value stays at **0.1**.
### KOL-δ (Dashed Red)
- **t = 0 → 1:** Control value starts at **0.7**, drops to **0.4** at t=1.
- **t = 1 → 3:** Fluctuates between **0.4** and **0.6**.
- **t = 3 → 4:** Drops to **0.1** and remains constant.
- **t = 4 → 5:** Control value decreases to **0.0**.
### KOL-m (Dotted Purple)
- **t = 0 → 1:** Control value starts at **0.4**, rises to **0.7** at t=1.
- **t = 1 → 3:** Remains at **0.7**.
- **t = 3 → 4:** Drops to **0.2** and remains constant.
- **t = 4 → 5:** Further decreases to **0.0**.
---
## System Parameters
- **C_I = 1:** Indicates a specific system configuration (e.g., input constraint).
- **C_u = 0:** Suggests no upper bound on control value (or a fixed reference).
---
## Observations
1. **ODE** exhibits the most abrupt transitions, maintaining high control values (0.7) for extended periods.
2. **KOL-δ** shows intermediate stability, with gradual adjustments and minor fluctuations.
3. **KOL-m** demonstrates the most gradual response, with delayed transitions and eventual convergence to 0.0.
---
## Technical Notes
- The chart uses dashed grid lines for reference, enhancing readability of step changes.
- All control strategies converge to **u_opt = 0.0** by t=5, indicating system stabilization under the given parameters.