\n
## Scatter Plot Matrix: Principal Component Analysis (PCA) Results
### Overview
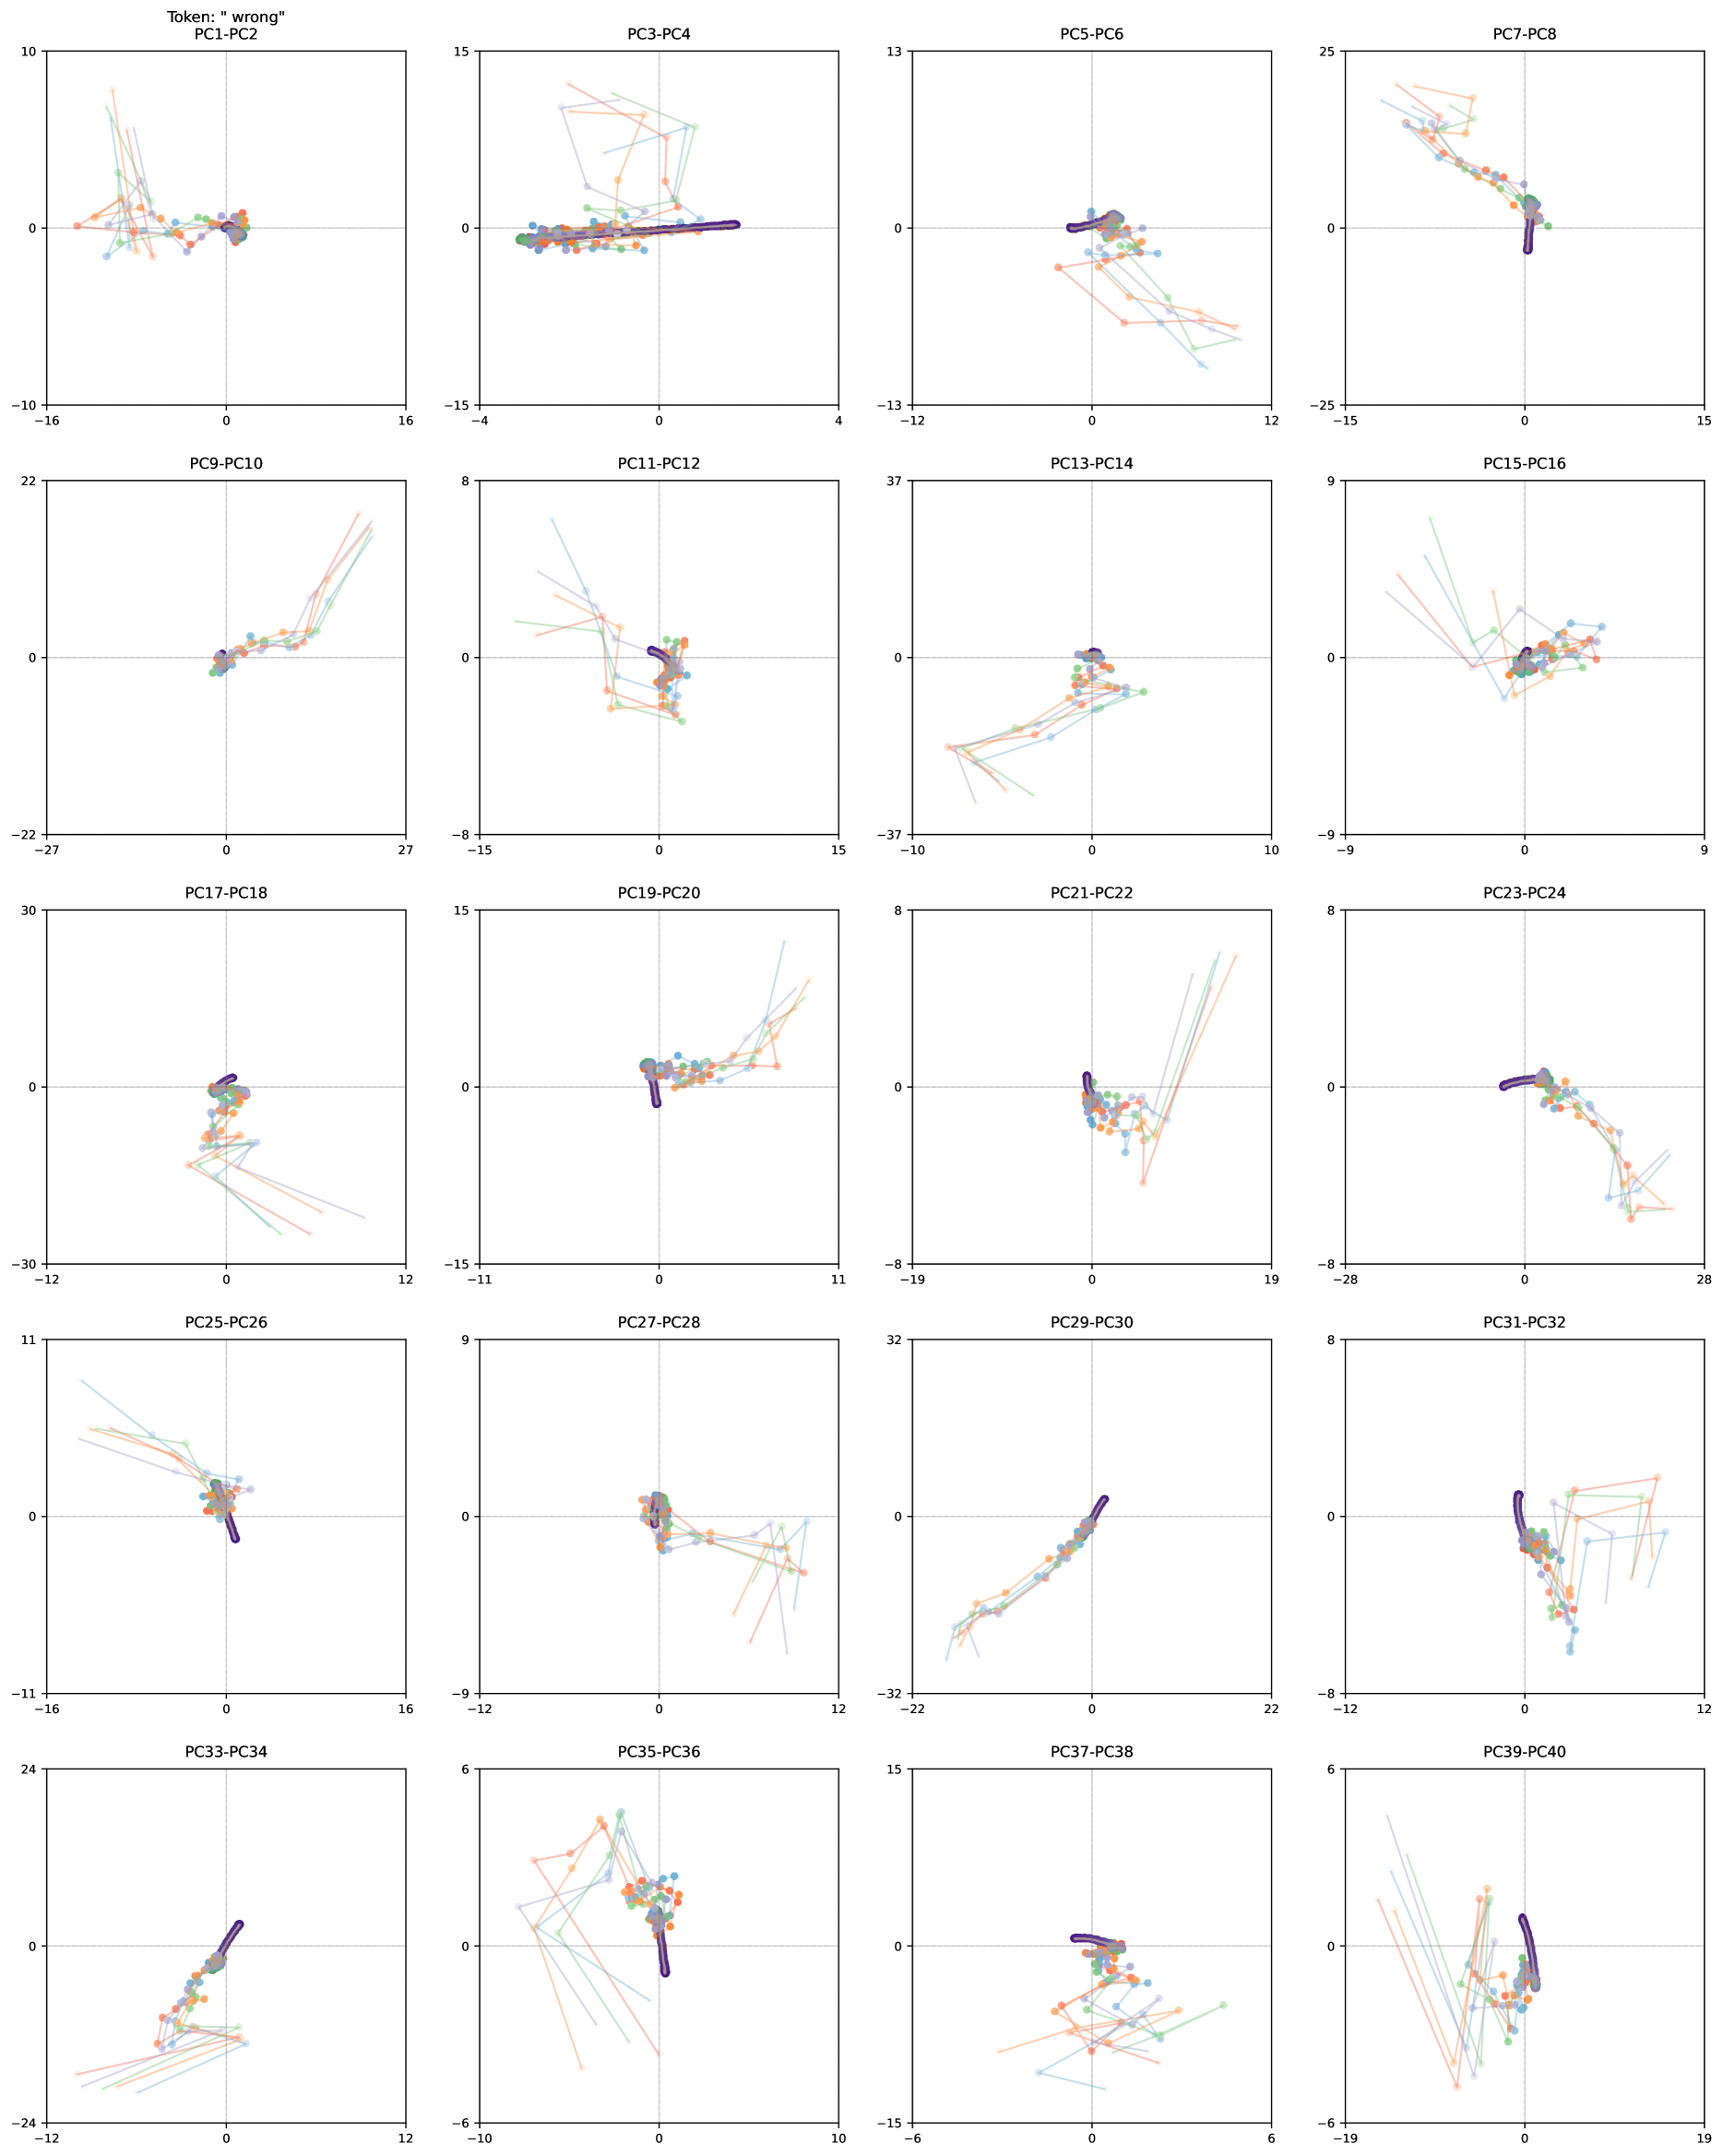
The image presents a scatter plot matrix displaying the results of a Principal Component Analysis (PCA). It consists of 20 individual scatter plots arranged in a 4x5 grid. Each plot visualizes the relationship between two principal components (PCs). Lines connect data points representing the same sample across the two PCs, allowing for visualization of trajectories in the reduced dimensional space. A "Token: 'wrong'" label is present in the top-left corner.
### Components/Axes
Each individual scatter plot has the following components:
* **Title:** Indicates the two principal components being compared (e.g., "PC1-PC2", "PC3-PC4", etc.).
* **X-axis:** Represents the values of the first principal component in the title. Scale varies per plot, ranging from approximately -37 to 32.
* **Y-axis:** Represents the values of the second principal component in the title. Scale varies per plot, ranging from approximately -32 to 10.
* **Data Points:** Represent individual samples projected onto the two principal components. Each sample is represented by a line connecting its coordinates on the two axes.
* **Line Colors:** Each line is assigned a unique color, presumably representing different groups or categories of samples. A legend is not present in the image.
The plots are arranged as follows:
* **Row 1:** PC1-PC2, PC3-PC4, PC5-PC6, PC7-PC8
* **Row 2:** PC9-PC10, PC11-PC12, PC13-PC14, PC15-PC16
* **Row 3:** PC17-PC18, PC19-PC20, PC21-PC22, PC23-PC24
* **Row 4:** PC25-PC26, PC27-PC28, PC29-PC30, PC31-PC32, PC33-PC34, PC35-PC36, PC37-PC38, PC39-PC40
### Detailed Analysis or Content Details
Due to the absence of a legend, precise identification of sample groups based on color is difficult. However, we can describe the general trends observed in each plot.
* **PC1-PC2:** Lines generally slope downward, indicating a negative correlation between PC1 and PC2. Values range from approximately -10 to 10 for both axes.
* **PC3-PC4:** Lines are more scattered, with some sloping upward and others downward. PC3 ranges from approximately -4 to 16, and PC4 from approximately -15 to 15.
* **PC5-PC6:** Lines generally slope downward. PC5 ranges from approximately -15 to 15, and PC6 from approximately -13 to 12.
* **PC7-PC8:** Lines are scattered, with some clustering in the top-right quadrant. PC7 ranges from approximately -15 to 15, and PC8 from approximately -35 to 25.
* **PC9-PC10:** Lines are mostly horizontal. PC9 ranges from approximately -22 to 0, and PC10 from approximately -15 to 27.
* **PC11-PC12:** Lines are scattered. PC11 ranges from approximately -15 to 15, and PC12 from approximately -8 to 6.
* **PC13-PC14:** Lines are scattered. PC13 ranges from approximately -37 to 0, and PC14 from approximately -10 to 12.
* **PC15-PC16:** Lines are scattered. PC15 ranges from approximately -9 to 9, and PC16 from approximately -9 to 0.
* **PC17-PC18:** Lines are scattered. PC17 ranges from approximately -30 to 12, and PC18 from approximately -12 to 11.
* **PC19-PC20:** Lines are scattered. PC19 ranges from approximately -15 to 0, and PC20 from approximately -11 to 8.
* **PC21-PC22:** Lines are scattered. PC21 ranges from approximately -8 to 19, and PC22 from approximately -8 to 8.
* **PC23-PC24:** Lines are scattered. PC23 ranges from approximately -8 to 28, and PC24 from approximately -8 to 8.
* **PC25-PC26:** Lines are scattered. PC25 ranges from approximately -11 to 11, and PC26 from approximately -12 to 16.
* **PC27-PC28:** Lines are scattered. PC27 ranges from approximately -12 to 13, and PC28 from approximately -32 to 0.
* **PC29-PC30:** Lines are scattered. PC29 ranges from approximately -12 to 19, and PC30 from approximately -8 to 32.
* **PC31-PC32:** Lines are scattered. PC31 ranges from approximately -8 to 12, and PC32 from approximately -8 to 28.
* **PC33-PC34:** Lines are scattered. PC33 ranges from approximately -24 to 0, and PC34 from approximately -10 to 24.
* **PC35-PC36:** Lines are scattered. PC35 ranges from approximately -6 to 10, and PC36 from approximately -32 to 6.
* **PC37-PC38:** Lines are scattered. PC37 ranges from approximately -15 to 15, and PC38 from approximately -32 to 6.
* **PC39-PC40:** Lines are scattered. PC39 ranges from approximately -6 to 19, and PC40 from approximately -19 to 6.
### Key Observations
* The plots exhibit varying degrees of separation between the lines, suggesting different levels of variance explained by each pair of principal components.
* The scales of the axes differ significantly across the plots, indicating that the principal components have different ranges of values.
* Without a legend, it is difficult to interpret the meaning of the different line colors and identify distinct clusters or patterns.
* The "Token: 'wrong'" label suggests a potential issue or error in the PCA process or data.
### Interpretation
The scatter plot matrix provides a visual representation of the relationships between the principal components derived from a PCA. Each plot reveals how samples are distributed along two dimensions that capture the most significant variance in the original data. The absence of a legend limits the ability to draw definitive conclusions about the underlying data structure. However, the varying degrees of separation and the different scales of the axes suggest that the principal components capture different aspects of the data's variability. The "Token: 'wrong'" label warrants further investigation to determine the source of the error and its impact on the PCA results. The PCA is likely used for dimensionality reduction, and the plots help to understand how well the data is represented in the reduced space. The scattered nature of many plots suggests that a higher number of principal components might be needed to capture the full complexity of the data.