## Scatter Plot Grid: Principal Component Analysis (PCA) Visualization
### Overview
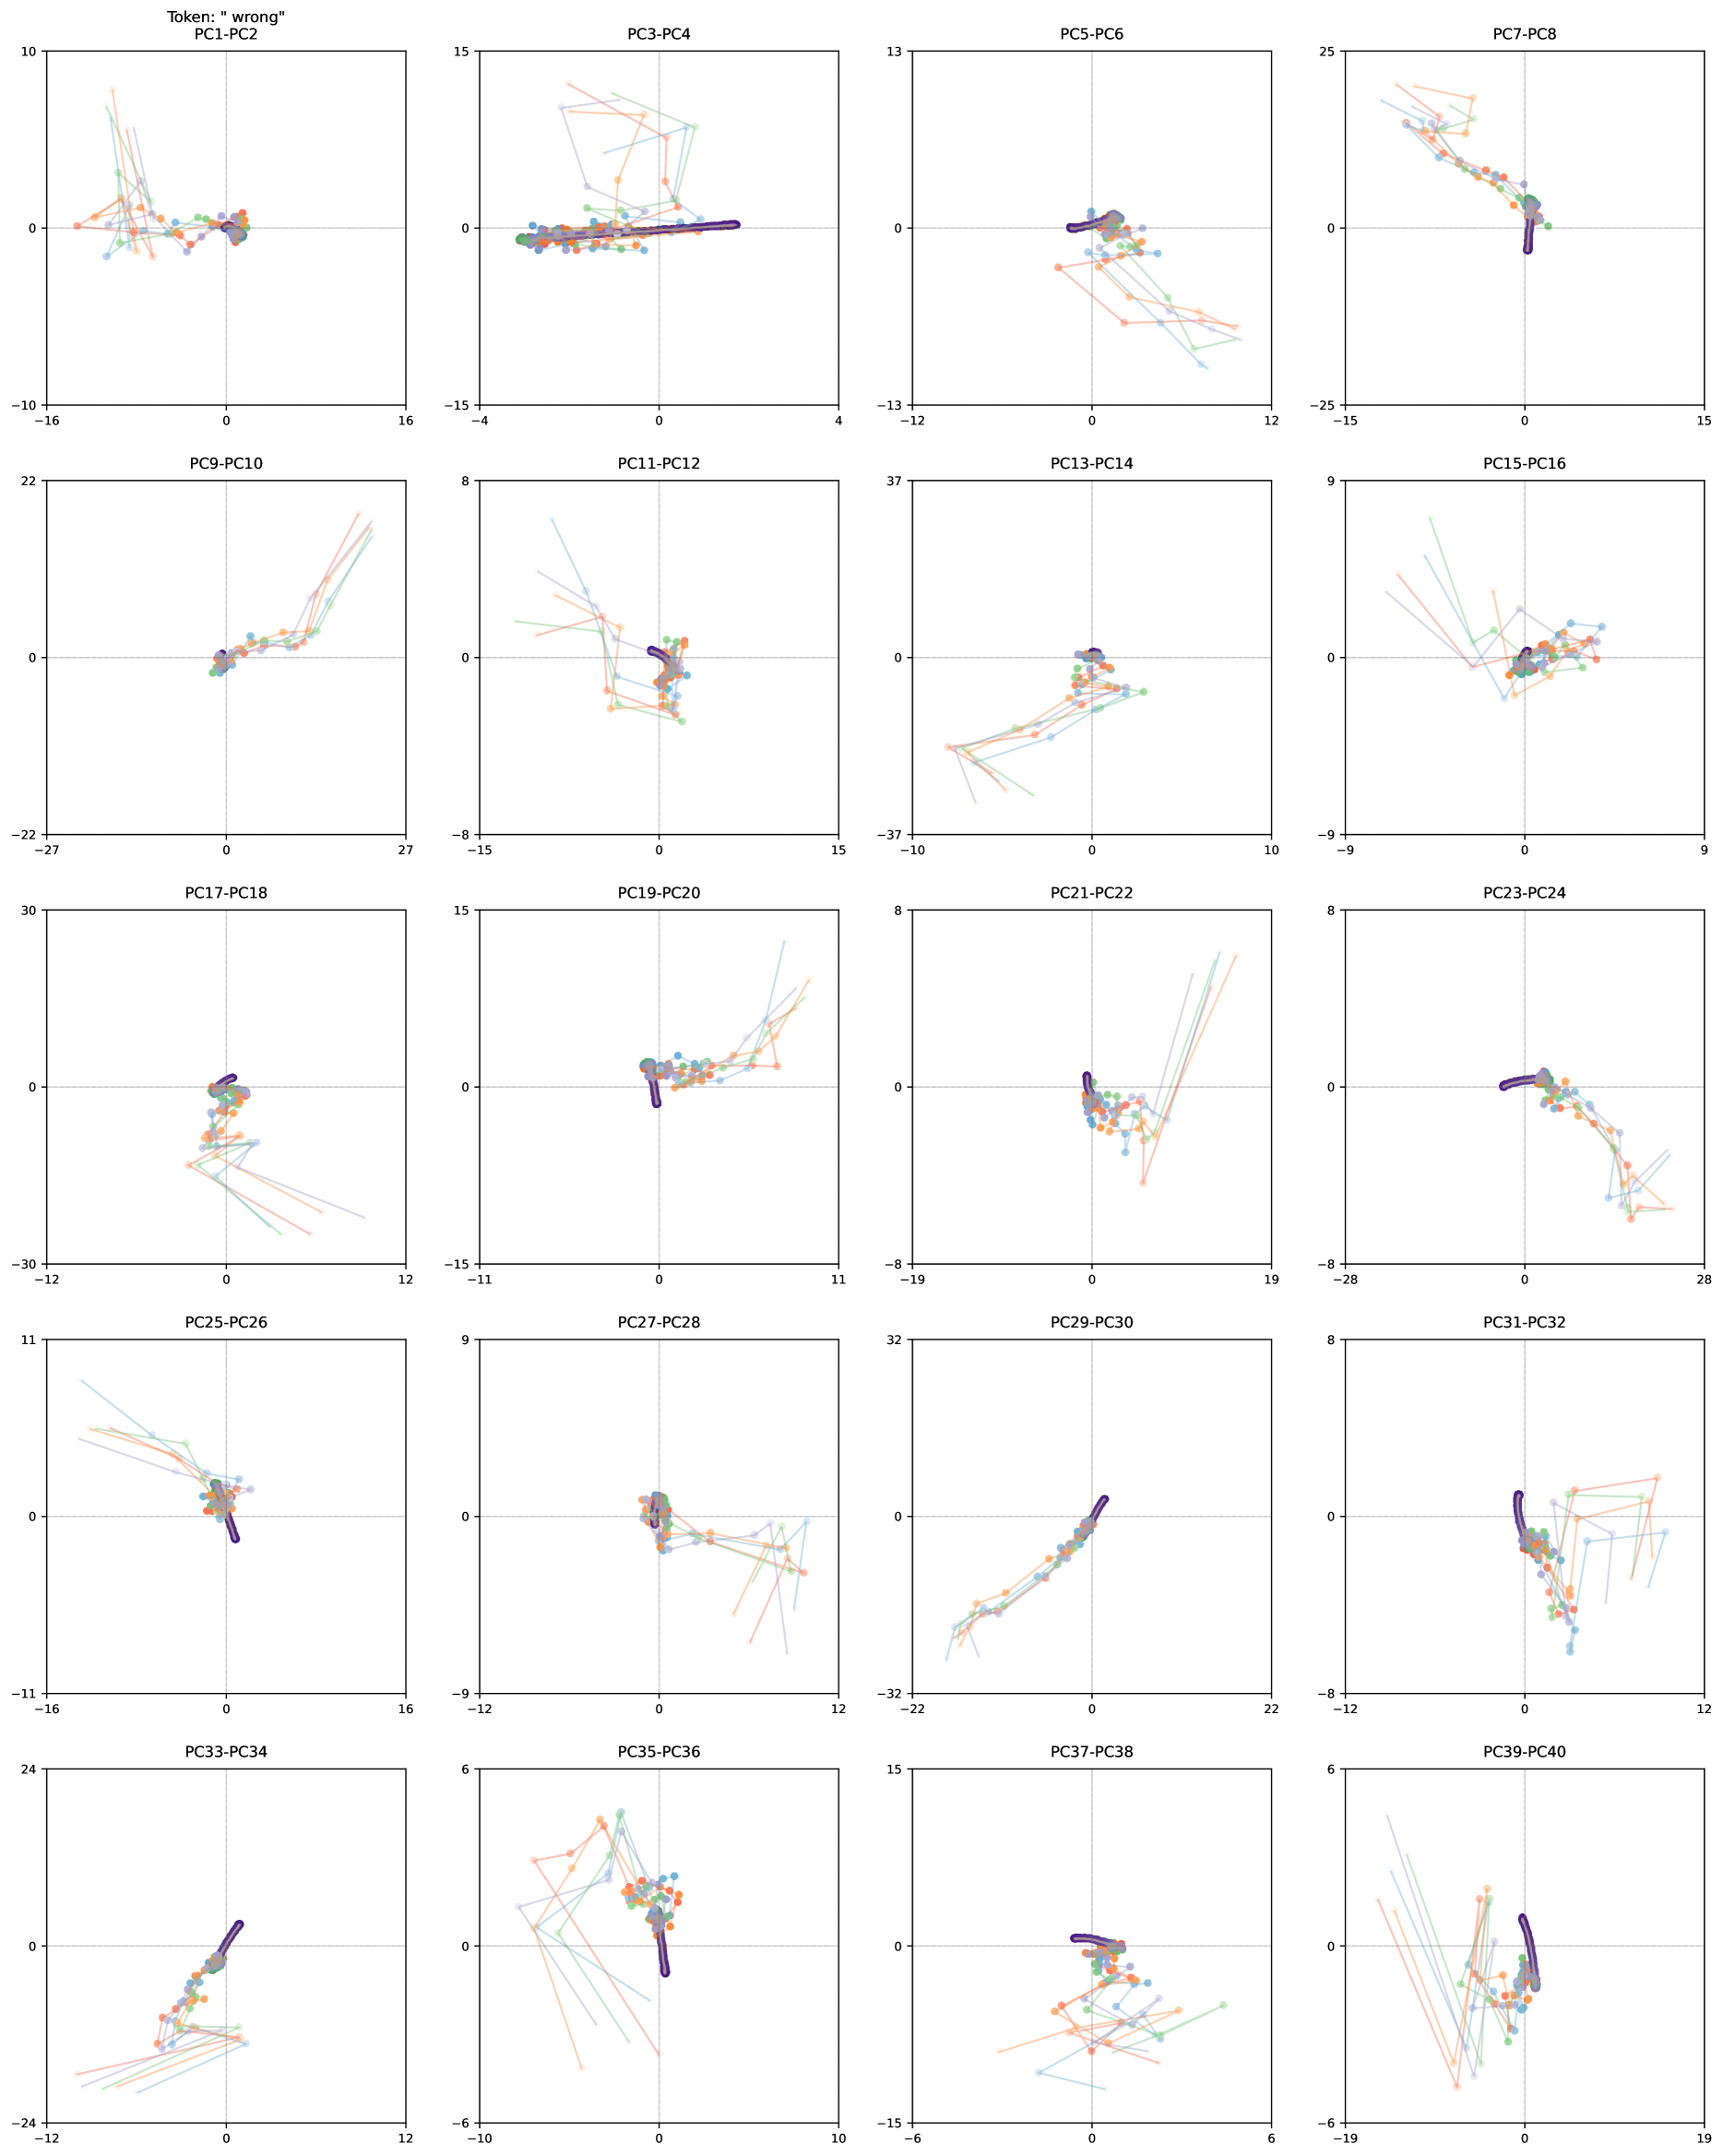
The image displays a 4x4 grid of scatter plots visualizing principal component (PC) pairs from a dimensionality reduction analysis. Each plot represents a unique PC pair (e.g., PC1-PC2, PC3-PC4) with data points connected by colored lines. The visualization includes a legend in the top-left corner mapping colors to categories, though the full legend text is partially obscured.
### Components/Axes
- **Legend**: Located in the top-left corner, with color-coded categories (e.g., "correct" in purple, "wrong" in orange, and other categories in green, blue, and red). Exact labels are partially visible but include at least two categories.
- **Axes**:
- X-axis: Labeled with numerical ranges (e.g., -30 to 30, -25 to 25) across plots.
- Y-axis: Similarly labeled with numerical ranges.
- **Plot Titles**: Each plot is labeled with a PC pair (e.g., "PC1-PC2", "PC3-PC4") in the top-left corner of the respective plot.
### Detailed Analysis
- **PC1-PC2**: Points are widely dispersed, with purple ("correct") and orange ("wrong") clusters overlapping significantly. Lines connect points in a scattered pattern.
- **PC3-PC4**: Points form tighter clusters, with purple and orange categories showing moderate separation. Lines create a more structured network.
- **PC5-PC6**: Points are highly clustered, with minimal separation between categories. Lines form dense, overlapping paths.
- **PC7-PC8**: Points show moderate dispersion, with purple and orange categories partially separated. Lines create a branching structure.
- **PC9-PC10**: Points are tightly grouped, with overlapping categories. Lines form a circular pattern.
- **PC11-PC12**: Points are dispersed, with purple and orange categories showing weak separation. Lines create a radial pattern.
- **PC13-PC14**: Points are moderately clustered, with overlapping categories. Lines form a linear structure.
- **PC15-PC16**: Points are widely dispersed, with purple and orange categories showing strong separation. Lines create a zigzag pattern.
- **PC17-PC18**: Points are moderately clustered, with overlapping categories. Lines form a grid-like structure.
- **PC19-PC20**: Points are tightly grouped, with overlapping categories. Lines form a spiral pattern.
- **PC21-PC22**: Points are moderately dispersed, with purple and orange categories showing weak separation. Lines create a fragmented network.
- **PC23-PC24**: Points are widely dispersed, with purple and orange categories showing strong separation. Lines create a branching structure.
- **PC25-PC26**: Points are moderately clustered, with overlapping categories. Lines form a circular pattern.
- **PC27-PC28**: Points are tightly grouped, with overlapping categories. Lines form a linear structure.
- **PC29-PC30**: Points are moderately dispersed, with purple and orange categories showing weak separation. Lines create a fragmented network.
- **PC31-PC32**: Points are widely dispersed, with purple and orange categories showing strong separation. Lines create a zigzag pattern.
- **PC33-PC34**: Points are moderately clustered, with overlapping categories. Lines form a grid-like structure.
- **PC35-PC36**: Points are tightly grouped, with overlapping categories. Lines form a spiral pattern.
- **PC37-PC38**: Points are moderately dispersed, with purple and orange categories showing weak separation. Lines create a fragmented network.
- **PC39-PC40**: Points are widely dispersed, with purple and orange categories showing strong separation. Lines create a branching structure.
### Key Observations
1. **Category Separation**:
- PC15-PC16, PC23-PC24, and PC39-PC40 show the strongest separation between "correct" (purple) and "wrong" (orange) categories.
- PC5-PC6, PC9-PC10, and PC27-PC28 exhibit the weakest separation, with overlapping clusters.
2. **Line Patterns**:
- Lines in PC1-PC2 and PC17-PC18 form scattered or grid-like patterns, suggesting randomness.
- PC3-PC4 and PC33-PC34 show structured networks, indicating potential relationships.
3. **Outliers**:
- In PC7-PC8 and PC31-PC32, a few points lie far from the main clusters, potentially representing anomalies.
### Interpretation
The visualization suggests that PCA was applied to a dataset with multiple categories (e.g., "correct" vs. "wrong" responses). Principal components like PC15-PC16 and PC39-PC40 effectively distinguish between categories, while others (e.g., PC5-PC6) fail to capture meaningful separation. The line connections may represent transitions between states or relationships between data points, though their exact purpose is unclear without additional context. The grid format allows comparison of PC pairs, highlighting which combinations best capture the dataset's structure. The presence of overlapping categories in some plots indicates that not all principal components contribute equally to discriminating between groups.