# Technical Document Extraction: Line Charts for Datasets A, B, and C
## Overview
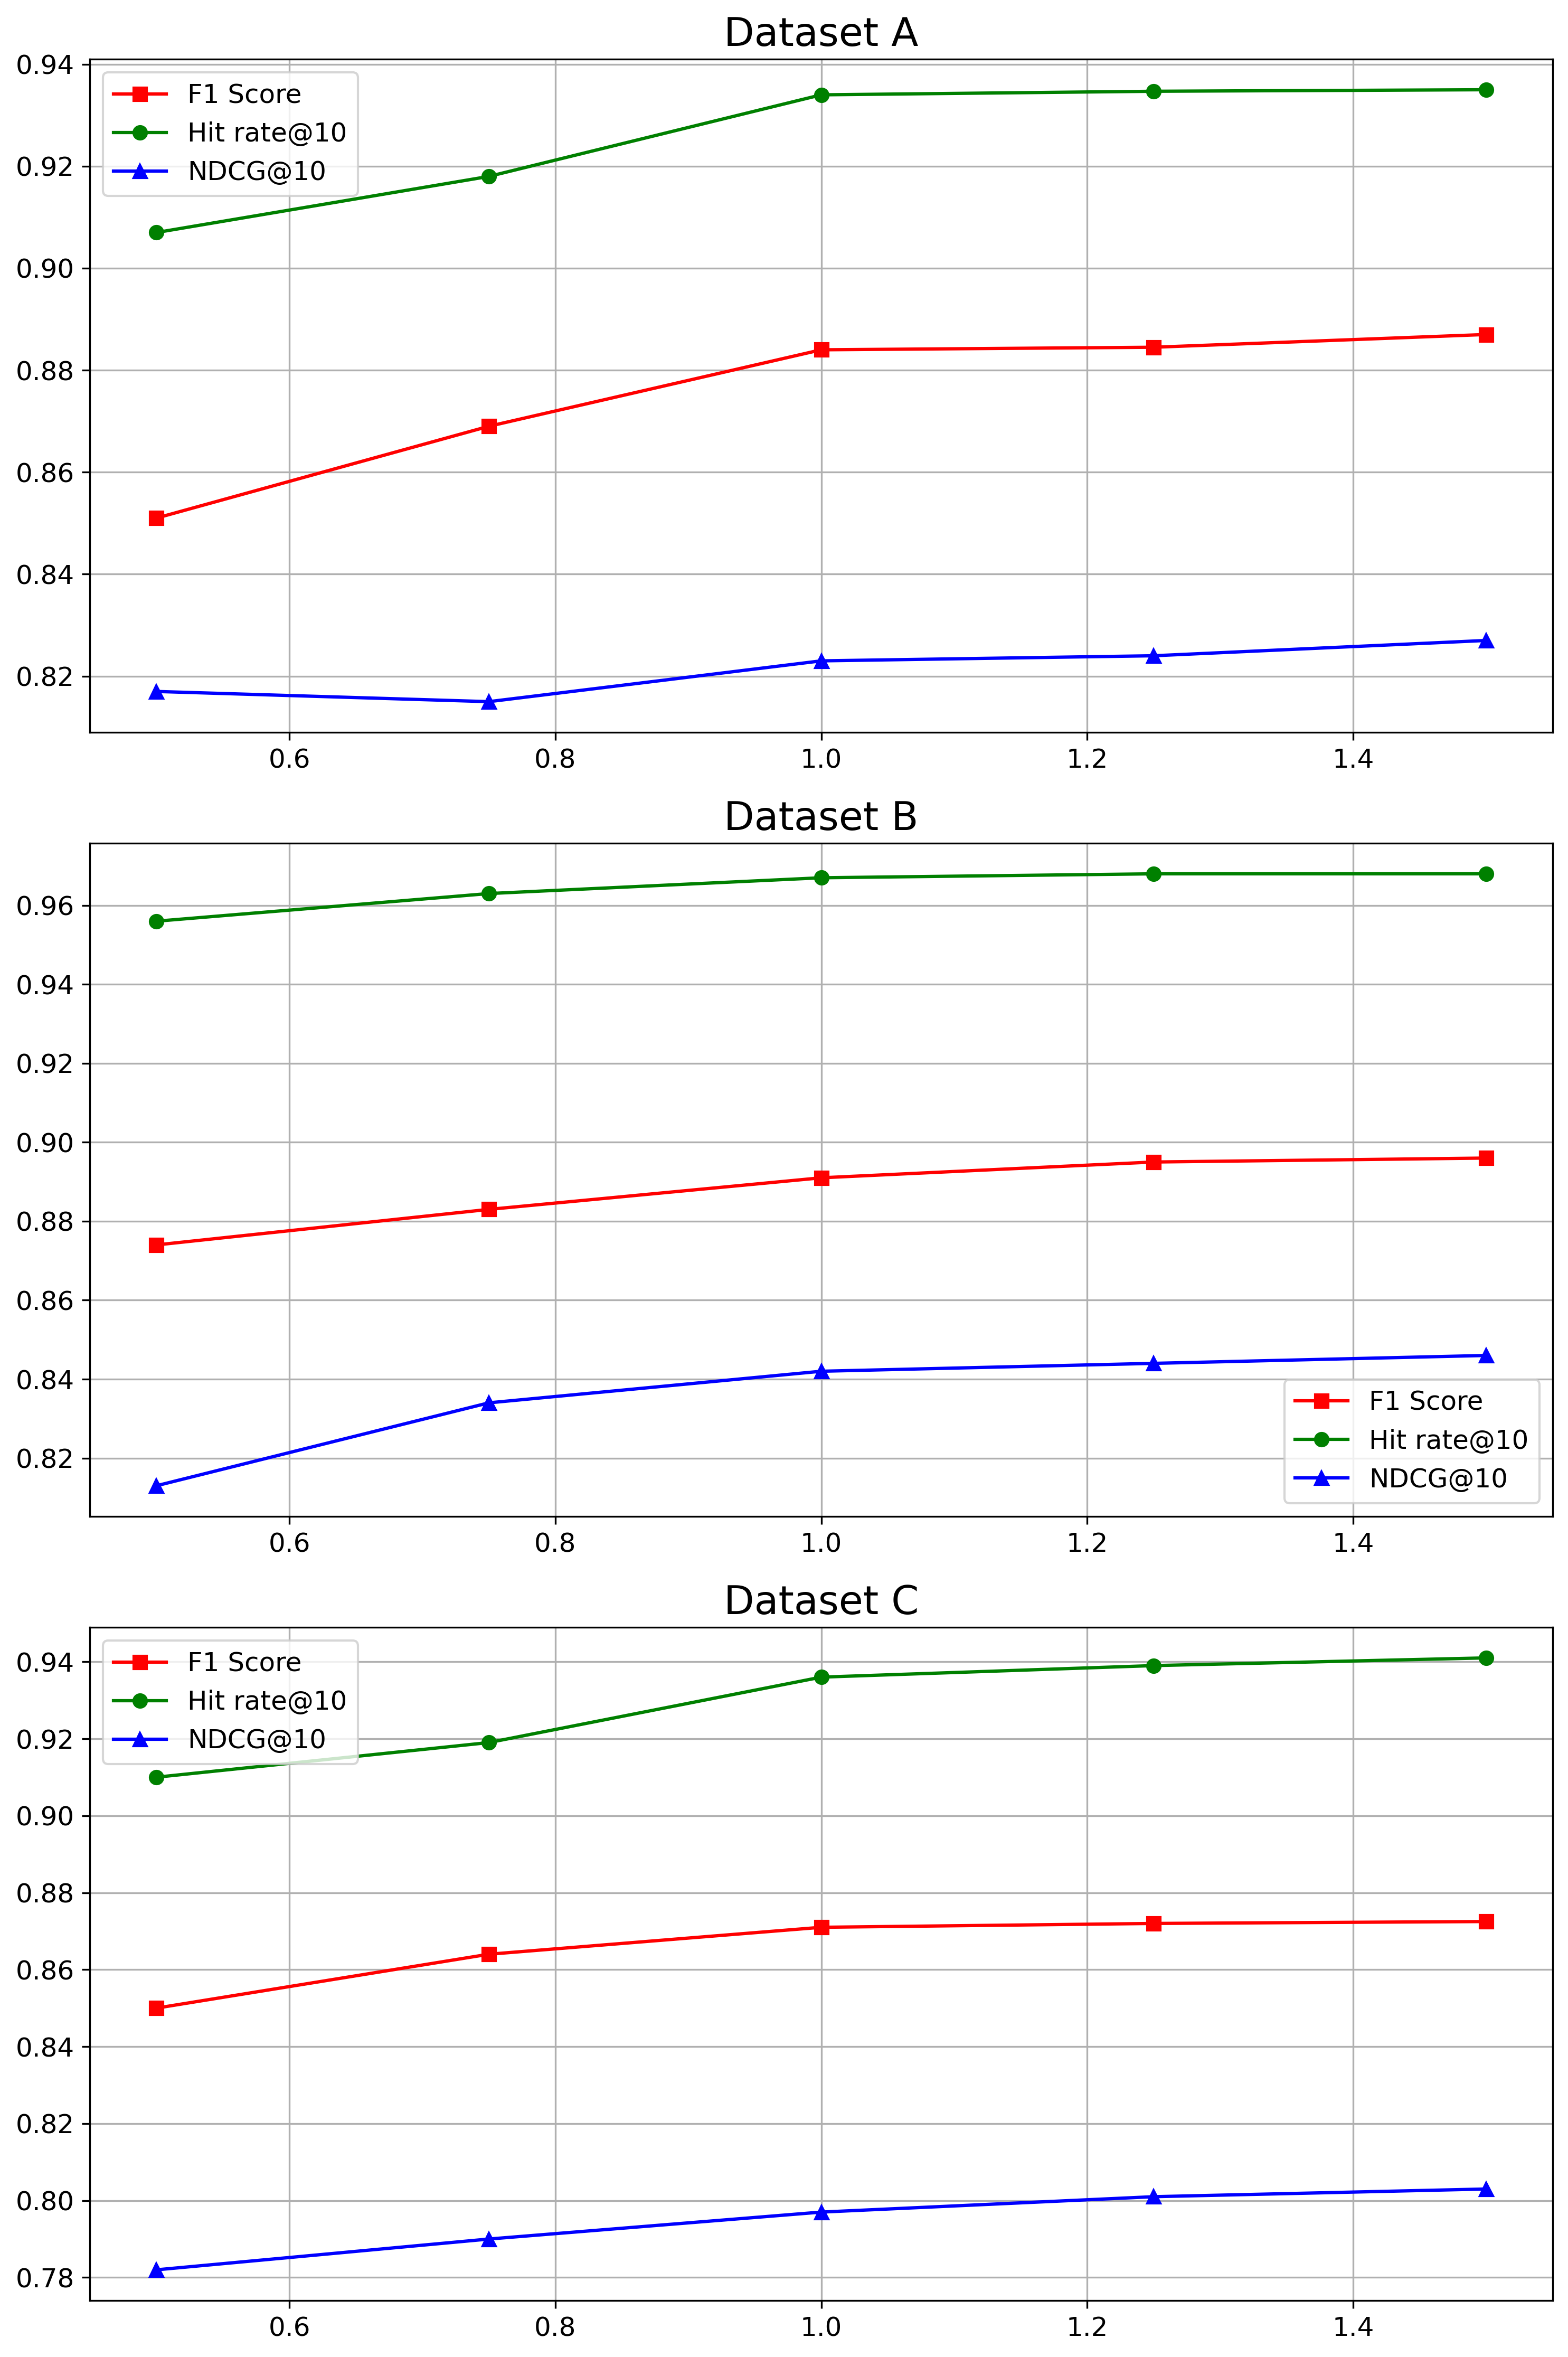
The image contains three line charts labeled **Dataset A**, **Dataset B**, and **Dataset C**, each comparing three performance metrics across a parameter range. The charts use distinct markers and colors for clarity, as defined in the legend.
---
### **Legend**
- **F1 Score**: Red squares (`■`)
- **Hit rate@10**: Green circles (`●`)
- **NDCG@10**: Blue triangles (`▲`)
---
### **Axis Labels and Markers**
- **X-Axis**:
- Title: "Parameter"
- Ticks: 0.6, 0.8, 1.0, 1.2, 1.4
- **Y-Axis**:
- Title: "Metric Value"
- Ticks: 0.78, 0.80, 0.82, 0.84, 0.86, 0.88, 0.90, 0.92, 0.94
---
### **Dataset A**
#### Key Trends
1. **F1 Score** (Red squares):
- Starts at ~0.85 (x=0.6) and increases steadily to ~0.88 (x=1.4).
- Slope: Linear upward trend.
2. **Hit rate@10** (Green circles):
- Begins at ~0.91 (x=0.6) and rises to ~0.93 (x=1.4).
- Slope: Linear upward trend.
3. **NDCG@10** (Blue triangles):
- Starts at ~0.82 (x=0.6) and increases slightly to ~0.83 (x=1.4).
- Slope: Gentle upward trend.
---
### **Dataset B**
#### Key Trends
1. **F1 Score** (Red squares):
- Begins at ~0.87 (x=0.6) and increases to ~0.89 (x=1.4).
- Slope: Linear upward trend.
2. **Hit rate@10** (Green circles):
- Starts at ~0.95 (x=0.6) and rises to ~0.96 (x=1.4).
- Slope: Linear upward trend.
3. **NDCG@10** (Blue triangles):
- Begins at ~0.82 (x=0.6) and increases to ~0.84 (x=1.4).
- Slope: Moderate upward trend.
---
### **Dataset C**
#### Key Trends
1. **F1 Score** (Red squares):
- Starts at ~0.85 (x=0.6), peaks at ~0.87 (x=1.0), then slightly declines to ~0.86 (x=1.4).
- Slope: Non-linear (increases then decreases).
2. **Hit rate@10** (Green circles):
- Begins at ~0.91 (x=0.6) and rises to ~0.93 (x=1.4).
- Slope: Linear upward trend.
3. **NDCG@10** (Blue triangles):
- Starts at ~0.78 (x=0.6) and increases to ~0.80 (x=1.4).
- Slope: Steady upward trend.
---
### **Cross-Referenced Observations**
- **Color Consistency**:
- Red squares (`■`) consistently represent **F1 Score** across all datasets.
- Green circles (`●`) represent **Hit rate@10**.
- Blue triangles (`▲`) represent **NDCG@10**.
- **Parameter Range**: All datasets share the same x-axis parameter range (0.6–1.4).
- **Metric Ranges**:
- **F1 Score**: 0.85–0.89 (Dataset A/B), 0.85–0.87 (Dataset C).
- **Hit rate@10**: 0.91–0.96 (Dataset A/B), 0.91–0.93 (Dataset C).
- **NDCG@10**: 0.78–0.84 (Dataset A/B), 0.78–0.80 (Dataset C).
---
### **Summary**
- **Dataset A**: All metrics show consistent upward trends.
- **Dataset B**: Similar to Dataset A, with higher baseline values for **Hit rate@10**.
- **Dataset C**: **F1 Score** exhibits a non-linear trend, while other metrics follow linear increases.