\n
## Diagram: Neural Association Model
### Overview
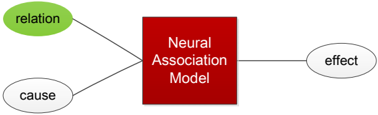
The image depicts a diagram illustrating a Neural Association Model. It shows a central red square labeled "Neural Association Model" with incoming arrows from "cause" and "relation" and an outgoing arrow to "effect". The diagram visually represents a process where a cause and a relation feed into a model, resulting in an effect.
### Components/Axes
The diagram consists of four labeled components:
* **Neural Association Model:** A red square positioned centrally.
* **cause:** An oval shape positioned on the bottom-left.
* **relation:** A green oval shape positioned on the top-left.
* **effect:** An oval shape positioned on the bottom-right.
Arrows connect these components, indicating the flow of information or influence.
### Detailed Analysis or Content Details
The diagram shows the following relationships:
* An arrow originates from the "cause" oval and points towards the "Neural Association Model" square.
* An arrow originates from the "relation" oval and points towards the "Neural Association Model" square.
* An arrow originates from the "Neural Association Model" square and points towards the "effect" oval.
The diagram does not contain any numerical data or scales. It is a conceptual representation of a process.
### Key Observations
The diagram highlights the central role of the "Neural Association Model" in mediating the relationship between "cause", "relation", and "effect". The arrows suggest a directional flow, implying that the cause and relation influence the model, which in turn produces an effect.
### Interpretation
The diagram illustrates a simplified model of how neural associations might work. It suggests that an effect is not solely determined by a single cause, but also by the relationship between the cause and other factors. The "Neural Association Model" acts as a processing unit that integrates the cause and relation to generate the effect. This could represent a cognitive process, a machine learning algorithm, or any system where associations between inputs lead to outputs. The diagram is a high-level conceptual representation and does not provide details about the internal workings of the model or the nature of the cause, relation, or effect. It is a visual metaphor for a complex process.