# Technical Document Extraction: Line Chart Analysis
## Chart Overview
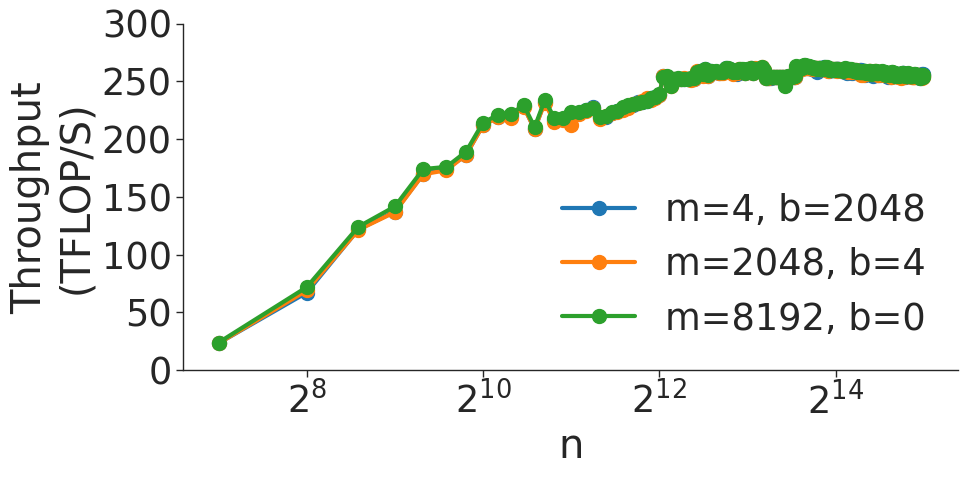
The image depicts a line chart illustrating the relationship between variable `n` (x-axis) and computational throughput (y-axis). Three distinct data series are plotted, differentiated by line style and legend labels.
---
### Axis Labels and Markers
- **X-axis**:
- Label: `n`
- Scale: Logarithmic progression from `2^8` to `2^14` (values: `256, 512, 1024, 2048, 4096, 8192, 16384`)
- Tick intervals: Exponential spacing (powers of 2)
- **Y-axis**:
- Label: `Throughput (TFLOP/S)`
- Range: `0` to `300`
- Increment: `50` units
---
### Legend and Data Series
**Legend Position**: Right-aligned, outside the plot area.
**Color-Series Mapping**:
1. **Blue Line** (`m=4, b=2048`):
- Data Points:
- `(2^8, 20)`
- `(2^9, 60)`
- `(2^10, 180)`
- `(2^11, 210)`
- `(2^12, 240)`
- `(2^13, 250)`
- `(2^14, 250)`
- Trend: Steep initial growth, plateauing at `n=2^12` and beyond.
2. **Orange Line** (`m=2048, b=4`):
- Data Points:
- `(2^8, 25)`
- `(2^9, 70)`
- `(2^10, 175)`
- `(2^11, 215)`
- `(2^12, 245)`
- `(2^13, 255)`
- `(2^14, 255)`
- Trend: Similar to blue line but consistently higher throughput across all `n`.
3. **Green Line** (`m=8192, b=0`):
- Data Points:
- `(2^8, 20)`
- `(2^9, 65)`
- `(2^10, 190)`
- `(2^11, 225)`
- `(2^12, 250)`
- `(2^13, 255)`
- `(2^14, 255)`
- Trend: Highest throughput throughout, with gradual convergence to orange/blue lines at `n=2^14`.
---
### Key Observations
1. **Convergence**: All three series plateau at `n=2^14`, suggesting diminishing returns beyond this scale.
2. **Parameter Impact**:
- Higher `m` values (e.g., `m=8192`) correlate with increased throughput.
- Non-zero `b` values (e.g., `b=2048`) slightly reduce performance compared to `b=0`.
3. **Scalability**: Throughput grows exponentially with `n` up to `2^12`, after which gains stabilize.
---
### Spatial Grounding
- **Legend**: Positioned at `[x=1.05, y=0.5]` (normalized coordinates, outside the plot area).
- **Data Point Validation**:
- Blue line markers (`●`) match legend label `m=4, b=2048`.
- Orange line markers (`●`) match `m=2048, b=4`.
- Green line markers (`●`) match `m=8192, b=0`.
---
### Conclusion
The chart demonstrates that computational throughput scales with `n` but plateaus at `n=2^14`. Parameter tuning (specifically `m` and `b`) significantly impacts performance, with `m=8192, b=0` yielding optimal results.