## Line Graph: Inverse of Squared Standard Deviation vs. Iterations
### Overview
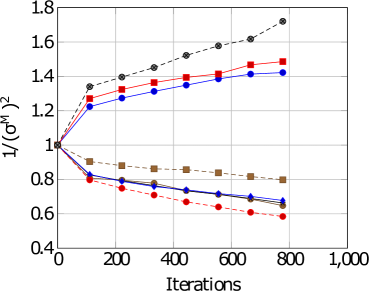
The image depicts a line graph comparing four data series labeled "A," "B," "C," and "D" across 1,000 iterations. The y-axis represents the inverse of the squared standard deviation (1/(σ_M²)), while the x-axis tracks iterations in increments of 200. All series originate at (0,1) and diverge as iterations increase.
### Components/Axes
- **X-axis (Horizontal)**: Labeled "Iterations," with ticks at 0, 200, 400, 600, 800, and 1,000.
- **Y-axis (Vertical)**: Labeled "1/(σ_M²)," with ticks at 0.4, 0.6, 0.8, 1.0, 1.2, 1.4, 1.6, and 1.8.
- **Legend**: Located in the top-right corner, associating:
- **Black dashed line with crosses**: Series A
- **Red solid line with squares**: Series B
- **Blue solid line with circles**: Series C
- **Brown dashed line with squares**: Series D
### Detailed Analysis
1. **Series A (Black Dashed Line)**:
- Starts at (0,1) and increases steadily.
- Reaches ~1.7 at 1,000 iterations.
- Slope: Linear upward trend.
2. **Series B (Red Solid Line)**:
- Begins at (0,1), dips slightly to ~0.8 at 200 iterations.
- Rises to ~1.5 by 1,000 iterations.
- Slope: Initial dip followed by gradual ascent.
3. **Series C (Blue Solid Line)**:
- Starts at (0,1), dips to ~0.7 at 200 iterations.
- Rises to ~1.4 by 1,000 iterations.
- Slope: Similar to Series B but with a steeper initial decline.
4. **Series D (Brown Dashed Line)**:
- Begins at (0,1), declines sharply to ~0.6 at 200 iterations.
- Remains flat at ~0.6 for subsequent iterations.
- Slope: Steep initial decline, then plateau.
### Key Observations
- **Series A** exhibits the most consistent growth, doubling its initial value.
- **Series B and C** show similar recovery patterns after initial dips, with Series B achieving higher final values.
- **Series D** diverges significantly, showing no recovery after an early drop.
- All series share the same starting point but diverge sharply after 200 iterations.
### Interpretation
The graph suggests that the inverse of squared standard deviation (1/(σ_M²)) behaves differently across the four series as iterations increase. Series A’s steady rise implies a consistent improvement or stabilization in the measured metric. Series B and C, despite initial declines, recover and grow, indicating potential resilience or adaptive behavior. Series D’s abrupt decline and stagnation may signal a critical failure or irreversible degradation in its underlying process. The divergence after 200 iterations highlights a threshold effect, where small differences in early iterations amplify over time. This could reflect sensitivity to initial conditions or external perturbations in the modeled system.