## Line Chart: F1(C) vs Number of Hidden Classes
### Overview
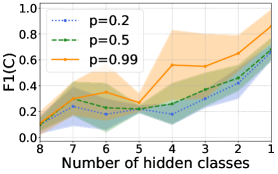
The chart displays three line series representing the relationship between the number of hidden classes (x-axis) and F1(C) score (y-axis). Each line corresponds to a different probability value (p=0.2, p=0.5, p=0.99), with shaded regions indicating variability/confidence intervals. The lines trend upward as the number of hidden classes decreases, with higher p-values showing stronger performance.
### Components/Axes
- **X-axis**: "Number of hidden classes" (integer values from 8 to 1, decreasing left to right)
- **Y-axis**: "F1(C)" (continuous scale from 0.0 to 1.0)
- **Legend**: Located in the top-left corner, with three entries:
- Dotted blue line: p=0.2
- Dashed green line: p=0.5
- Solid orange line: p=0.99
- **Shaded Regions**: Light-colored bands surrounding each line, representing confidence intervals or variability.
### Detailed Analysis
1. **p=0.2 (Dotted Blue Line)**:
- Starts at ~0.15 (x=8) and rises to ~0.45 (x=1).
- Shaded region spans ~0.10–0.20 at x=8, widening to ~0.30–0.50 at x=1.
- Trend: Gradual increase with moderate variability.
2. **p=0.5 (Dashed Green Line)**:
- Starts at ~0.20 (x=8) and rises to ~0.55 (x=1).
- Shaded region spans ~0.15–0.25 at x=8, widening to ~0.40–0.65 at x=1.
- Trend: Steeper increase than p=0.2, with higher variability at lower hidden classes.
3. **p=0.99 (Solid Orange Line)**:
- Starts at ~0.30 (x=8) and rises to ~0.85 (x=1).
- Shaded region spans ~0.25–0.35 at x=8, widening to ~0.70–0.95 at x=1.
- Trend: Sharpest increase, with the highest F1(C) values across all hidden class counts.
### Key Observations
- **Inverse Relationship**: F1(C) improves as the number of hidden classes decreases for all p-values.
- **p-Value Impact**: Higher p-values (e.g., 0.99) consistently outperform lower p-values (e.g., 0.2) across all hidden class counts.
- **Variability**: Shaded regions widen as hidden classes decrease, suggesting greater uncertainty at lower hidden class counts.
- **Peak Performance**: At x=1 (1 hidden class), p=0.99 achieves ~0.85 F1(C), while p=0.2 achieves ~0.45.
### Interpretation
The data suggests that model performance (F1(C)) improves with fewer hidden classes and higher certainty (p-value). The shaded regions indicate that higher p-values (e.g., 0.99) exhibit more stable performance, as their confidence intervals are narrower relative to their F1(C) values. The steepest gains occur when reducing hidden classes from 5 to 1, particularly for high-certainty models (p=0.99). This implies that simplifying the model (fewer hidden classes) and increasing certainty (higher p) synergistically enhance performance. The p=0.2 line’s lower performance and wider variability at x=1 highlight the importance of model confidence in achieving reliable results.