## Line Chart: Continual Train
### Overview
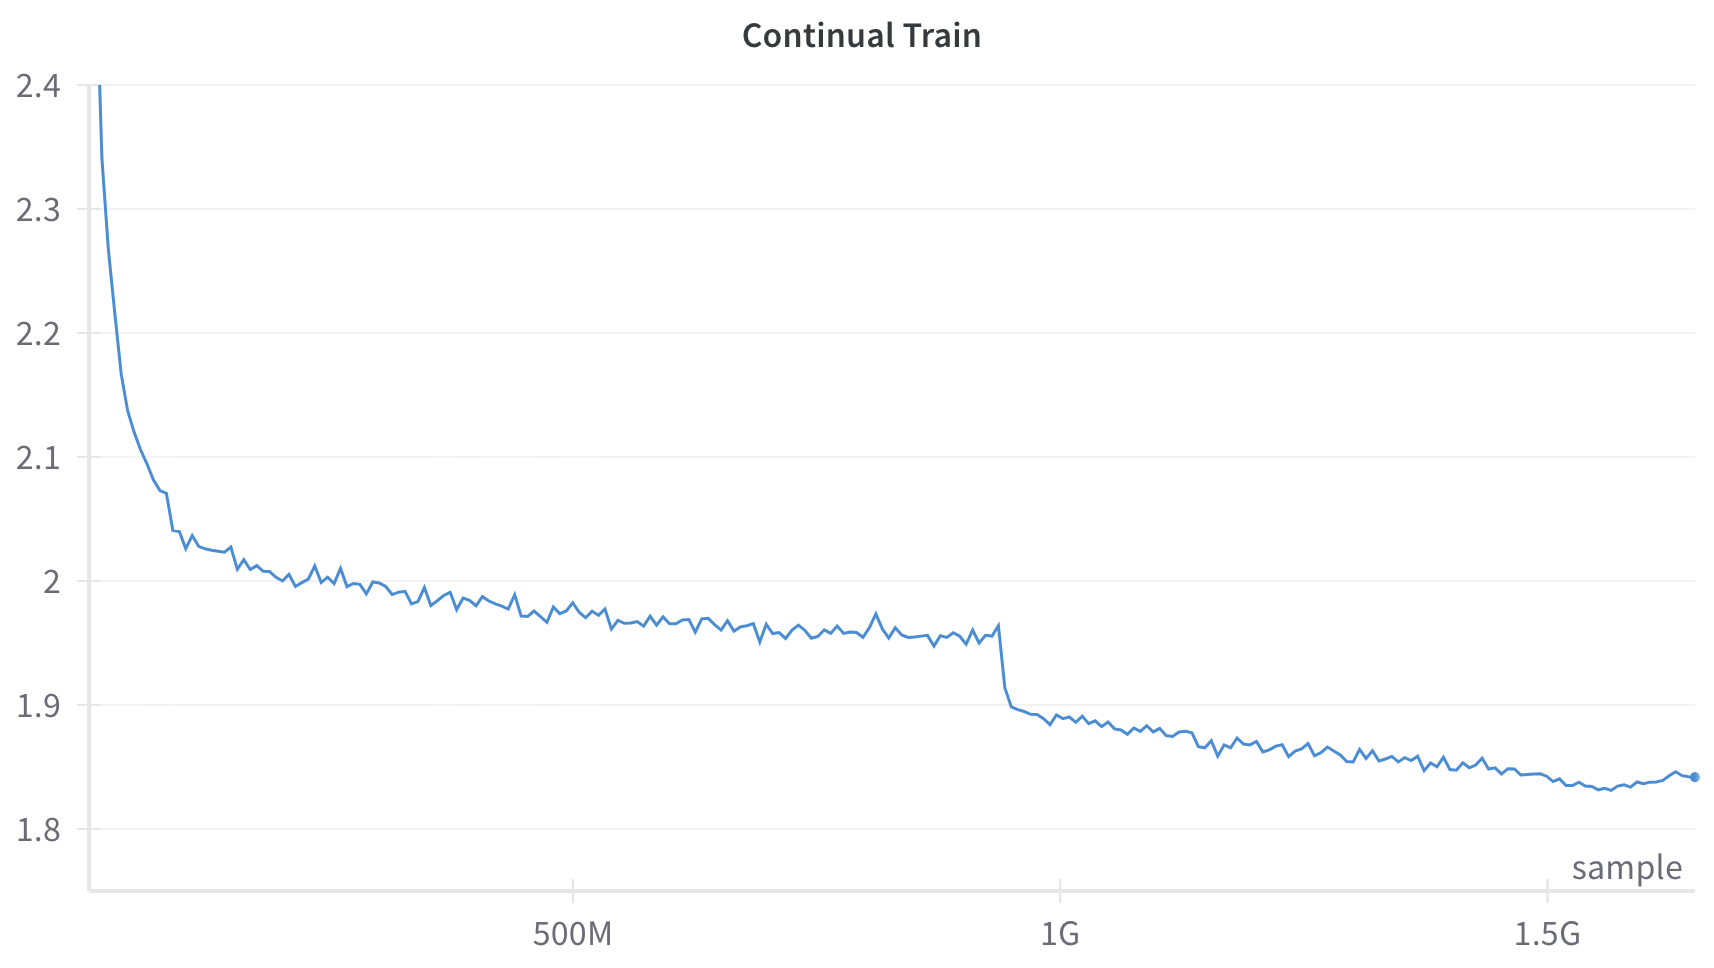
The image is a line chart titled "Continual Train". It displays a single blue line representing a data series that decreases over the x-axis, which is labeled "sample" and measured in units of data volume (500M, 1G, 1.5G). The y-axis represents an unspecified metric, ranging from 1.8 to 2.4. The line shows a rapid initial decrease, followed by a more gradual decline, with a noticeable drop around the 1G mark.
### Components/Axes
* **Title:** Continual Train
* **X-axis:**
* Label: sample
* Scale: 0 to 1.5G
* Markers: 500M, 1G, 1.5G
* **Y-axis:**
* Scale: 1.8 to 2.4
* Markers: 1.8, 1.9, 2, 2.1, 2.2, 2.3, 2.4
* **Data Series:** Single blue line. No legend is present, so the meaning of the line is not explicitly defined.
### Detailed Analysis
* **Data Series Trend:** The blue line shows a decreasing trend.
* From the start to 500M, the line decreases rapidly from approximately 2.4 to 2.0.
* From 500M to 1G, the line decreases gradually from approximately 2.0 to 1.95, with some minor fluctuations.
* At 1G, there is a sharp drop in the line.
* From 1G to 1.5G, the line continues to decrease gradually from approximately 1.9 to 1.85, with minor fluctuations.
### Key Observations
* The most significant drop in the data series occurs between 0 and 500M.
* A secondary, smaller drop occurs at 1G.
* The rate of decrease slows down considerably after 500M.
* The data series appears to be approaching a stable value near 1.85 towards the end of the chart.
### Interpretation
The chart likely represents the training progress of a machine learning model in a continual learning setting. The y-axis could represent a loss function or error rate, which decreases as the model is trained on more data ("sample" on the x-axis). The rapid initial decrease suggests fast initial learning, while the subsequent gradual decline indicates diminishing returns. The drop at 1G might indicate a change in the training process, such as the introduction of new data or a change in the learning rate. The overall trend suggests that the model is learning, but the rate of learning decreases over time.