\n
## Line Chart: Continual Train
### Overview
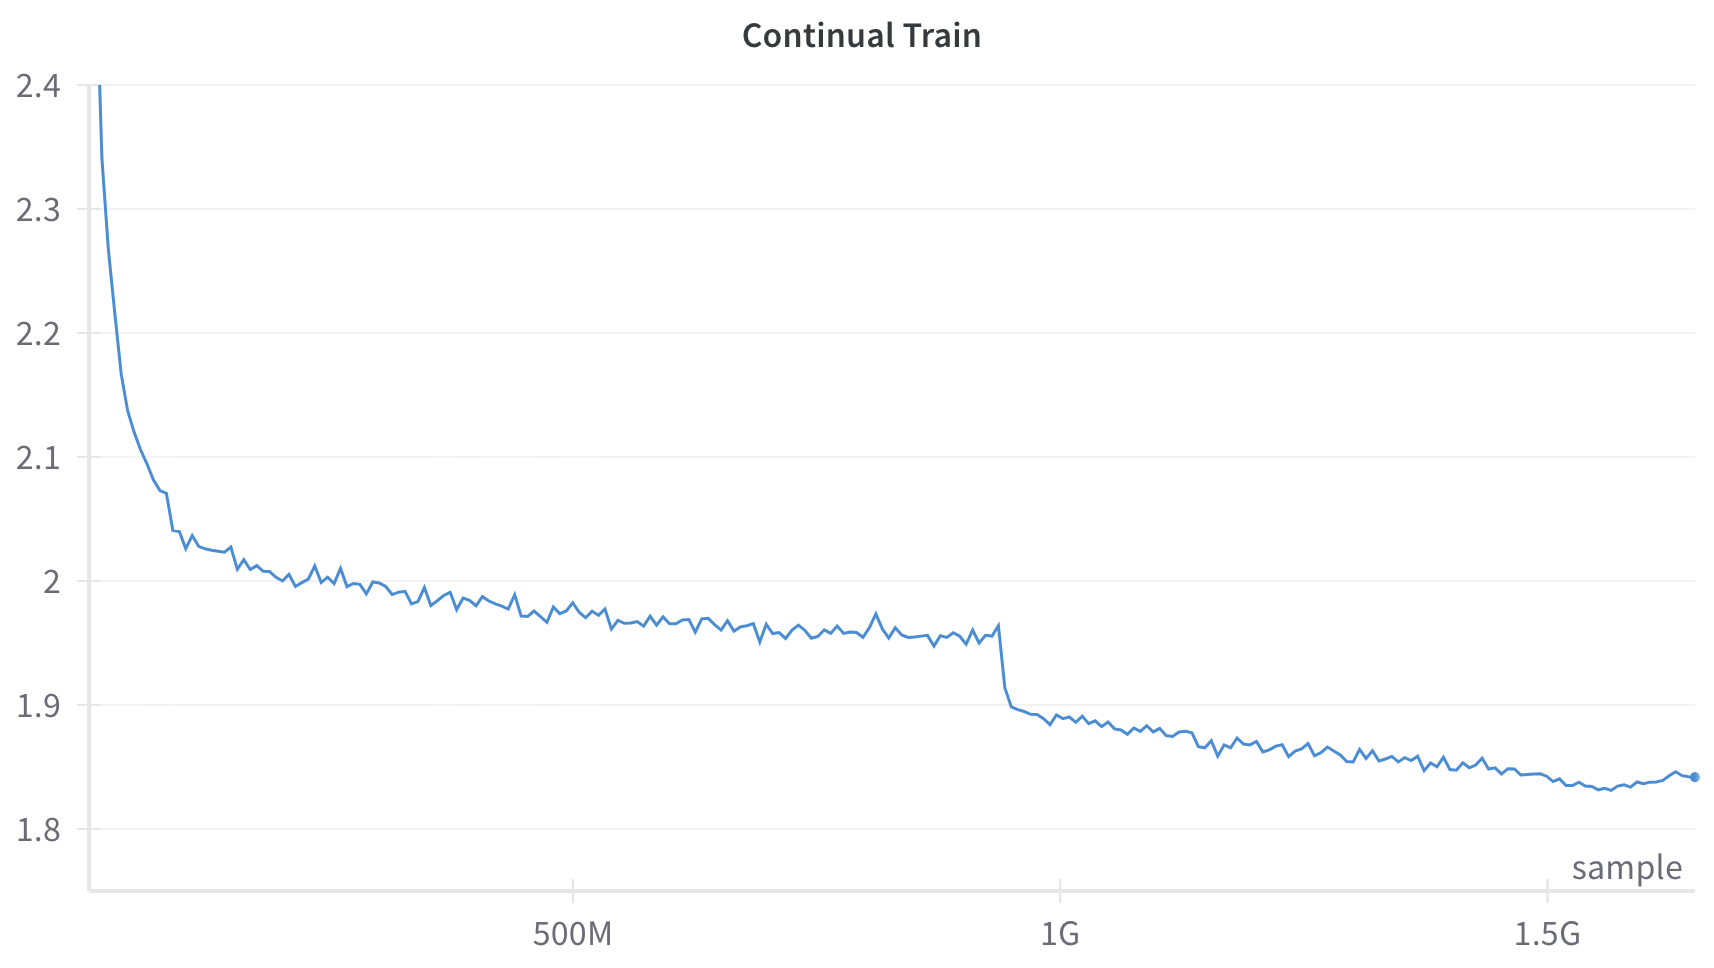
The image presents a line chart depicting a decreasing trend over a horizontal axis representing a quantity measured in "M" (millions) and "G" (billions), likely representing data size or training steps. The vertical axis represents a numerical value ranging from approximately 1.8 to 2.4. The chart appears to illustrate the performance of a "Continual Train" process, with the value decreasing as the horizontal axis increases.
### Components/Axes
* **Title:** "Continual Train" - positioned at the top-center of the chart.
* **X-axis:** Labeled with numerical values in millions and billions (e.g., 500M, 1G, 1.5G). The axis appears to represent the progression of training or data processed.
* **Y-axis:** Ranges from approximately 1.8 to 2.4, with gridlines at intervals of 0.1. The axis represents a numerical value, potentially a loss function or error rate.
* **Data Series:** A single blue line representing the "sample" data.
* **Legend:** "sample" - positioned at the bottom-right of the chart.
### Detailed Analysis
The chart displays a single data series, a blue line labeled "sample". The line exhibits a steep downward slope initially, followed by a period of oscillation around a value of approximately 2.0. Around 1G, there is another noticeable drop in the value, followed by a more gradual decrease and stabilization around 1.85.
Here's a breakdown of approximate data points:
* **Initial Point (around 0M):** Approximately 2.35
* **250M:** Approximately 2.15
* **500M:** Approximately 2.05
* **750M:** Approximately 2.02
* **1G:** Approximately 1.95
* **1.25G:** Approximately 1.88
* **1.5G:** Approximately 1.85
The line initially decreases rapidly from 2.35 to around 2.05 between 0M and 500M. It then fluctuates between approximately 1.98 and 2.05 from 500M to 1G. After 1G, the line drops to approximately 1.95 and then stabilizes around 1.85-1.90.
### Key Observations
* The most significant drop in the value occurs between 0M and 500M.
* There's a period of relative stability between 500M and 1G, with minor fluctuations.
* A second, smaller drop occurs around 1G, followed by a plateau.
* The data suggests a diminishing return as the horizontal axis increases, with the rate of decrease slowing down over time.
### Interpretation
The chart likely represents the training process of a machine learning model using a continual learning approach. The y-axis could represent a loss function, and the x-axis represents the amount of data processed or training steps. The initial steep decrease indicates rapid learning in the early stages. The subsequent oscillations and plateau suggest that the model is converging and further training yields diminishing improvements. The drop around 1G could indicate a change in the data distribution or a shift in the learning process. The stabilization around 1.85 suggests that the model has reached a point of diminishing returns and further training may not significantly improve performance. The continual train process appears to be effective in reducing the loss function, but the rate of improvement decreases over time. The data suggests that the model is learning, but may be approaching a point where additional training is no longer beneficial.