## Line Graph: Continual Train
### Overview
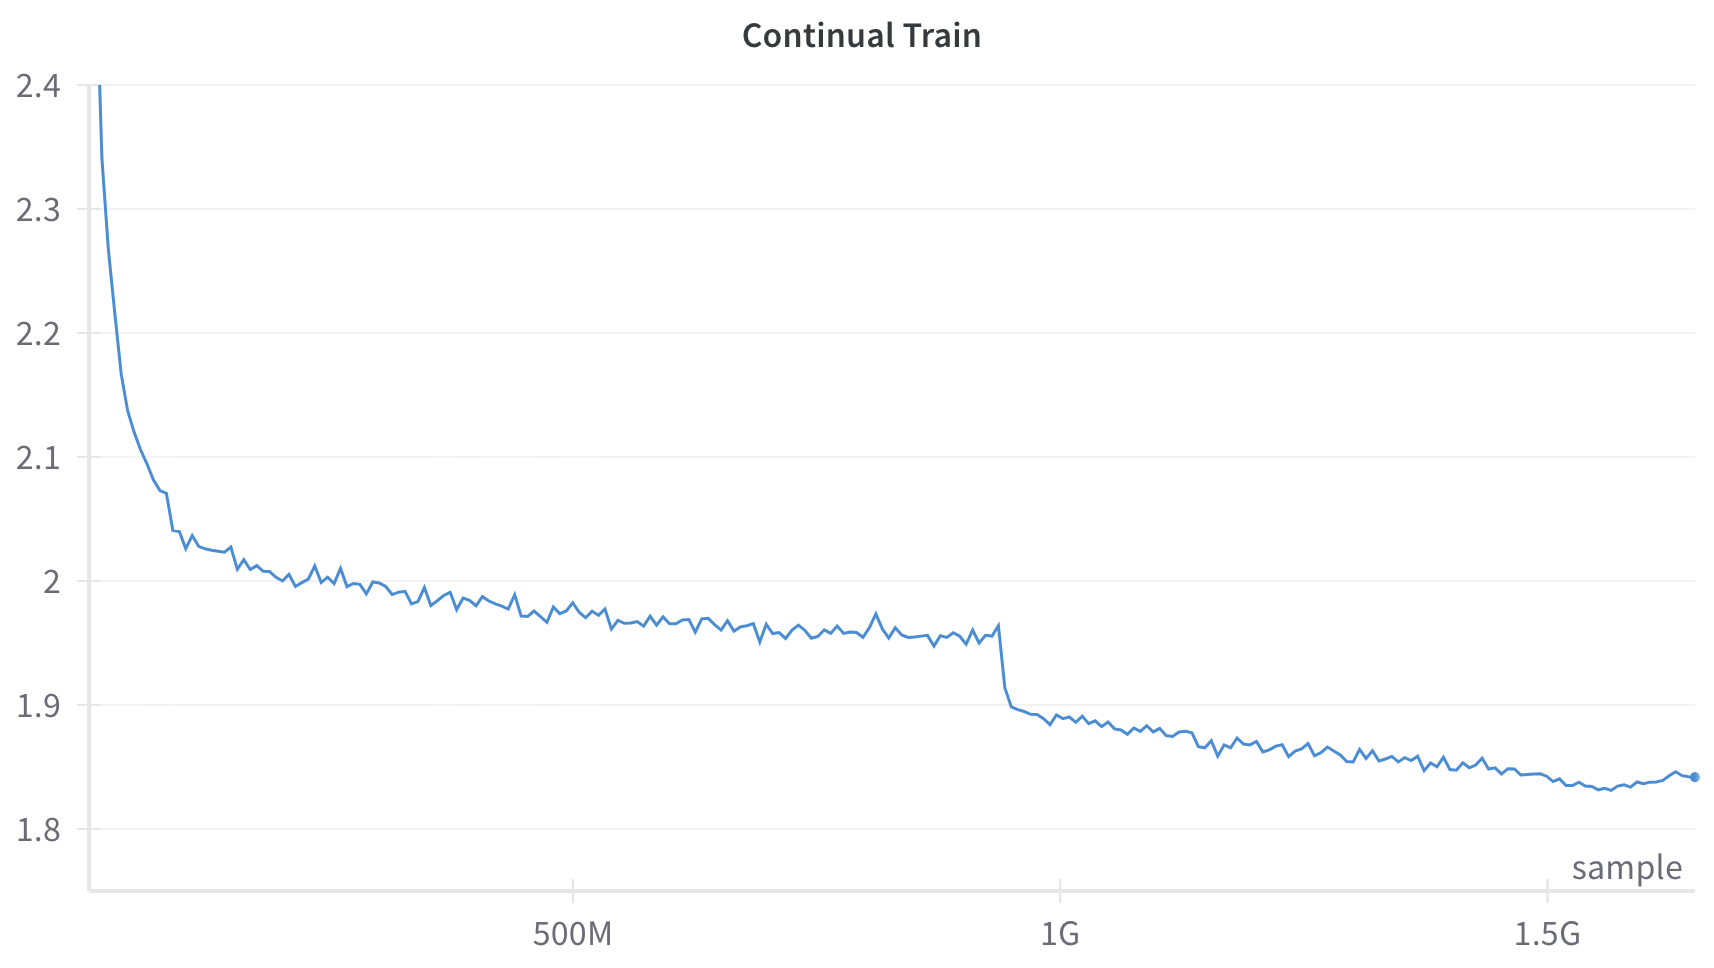
The image depicts a line graph titled "Continual Train," showing a single blue line representing a metric labeled "sample" over a range of values on the x-axis. The y-axis ranges from 1.8 to 2.4, while the x-axis spans from 500M to 1.5G. The line exhibits a sharp initial decline, followed by gradual fluctuations and a steeper drop after 1G.
### Components/Axes
- **Title**: "Continual Train" (centered at the top).
- **Y-Axis**: Labeled "sample," with values from 1.8 to 2.4 in increments of 0.1.
- **X-Axis**: Labeled with approximate values: 500M, 1G, and 1.5G (spaced linearly).
- **Legend**: Located at the bottom-right corner, labeled "sample" with a blue line.
- **Line**: A single blue line with jagged fluctuations, starting at the top-left and ending at the bottom-right.
### Detailed Analysis
- **Initial Drop**: The line begins at approximately **2.4** on the y-axis and plunges sharply to ~2.0 within the first 500M on the x-axis.
- **Mid-Range Fluctuations**: Between 500M and 1G, the line stabilizes between **1.9 and 2.0**, with minor oscillations.
- **Post-1G Decline**: After 1G, the line drops steeply to ~1.85 by 1.5G, with continued fluctuations.
### Key Observations
1. **Sharp Initial Decline**: The metric "sample" decreases rapidly from 2.4 to 2.0 within the first 500M.
2. **Stabilization Phase**: Between 500M and 1G, the metric fluctuates minimally around 1.9–2.0.
3. **Accelerated Decline Post-1G**: After 1G, the metric drops more sharply, reaching ~1.85 by 1.5G.
4. **Noise**: The line exhibits irregular fluctuations throughout, suggesting variability in the data.
### Interpretation
The graph demonstrates a **non-linear decline** in the "sample" metric over time. The initial sharp drop may indicate an abrupt change or event, followed by a period of relative stability. The steeper decline after 1G suggests a renewed acceleration in the decrease, possibly due to a secondary factor or process. The fluctuations imply inherent variability in the system being measured. Without additional context, the exact nature of "sample" remains ambiguous, but the trend highlights a progressive reduction in the metric over increasing x-axis values. The data could represent phenomena such as resource depletion, decay, or efficiency loss in a system over time.