## Line Chart: Number of Argmax vs. ASCII of test_num
### Overview
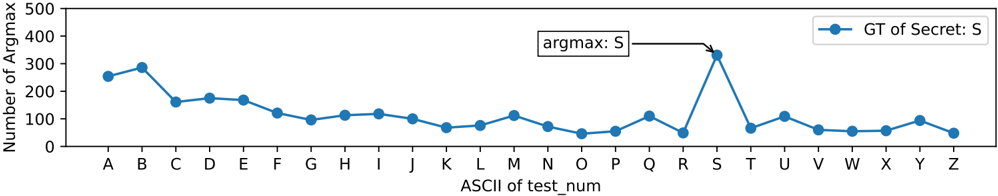
The image is a line chart showing the "Number of Argmax" on the y-axis versus the "ASCII of test_num" on the x-axis. The x-axis represents the letters of the alphabet from A to Z. The chart includes a legend indicating that the blue line represents "GT of Secret: S". There is a peak at the letter 'S', which is annotated with "argmax: S".
### Components/Axes
* **X-axis:** "ASCII of test_num" with labels A, B, C, D, E, F, G, H, I, J, K, L, M, N, O, P, Q, R, S, T, U, V, W, X, Y, Z.
* **Y-axis:** "Number of Argmax" with scale from 0 to 500. Tick marks are present at 0, 100, 200, 300, 400, and 500.
* **Legend:** Located in the top-right corner, indicating that the blue line represents "GT of Secret: S".
* **Annotation:** A text box with "argmax: S" points to the peak at 'S' on the x-axis.
### Detailed Analysis
The data series (blue line) shows the number of argmax values for each letter of the alphabet.
* **A:** Approximately 260
* **B:** Approximately 290
* **C:** Approximately 160
* **D:** Approximately 170
* **E:** Approximately 170
* **F:** Approximately 110
* **G:** Approximately 90
* **H:** Approximately 110
* **I:** Approximately 110
* **J:** Approximately 90
* **K:** Approximately 70
* **L:** Approximately 60
* **M:** Approximately 110
* **N:** Approximately 50
* **O:** Approximately 40
* **P:** Approximately 40
* **Q:** Approximately 100
* **R:** Approximately 40
* **S:** Approximately 350
* **T:** Approximately 60
* **U:** Approximately 100
* **V:** Approximately 50
* **W:** Approximately 50
* **X:** Approximately 50
* **Y:** Approximately 90
* **Z:** Approximately 50
The line starts at approximately 260 for 'A', rises to approximately 290 for 'B', then decreases to approximately 160 for 'C'. It fluctuates between 170 and 40 until it reaches 'S', where it spikes to approximately 350. After 'S', it drops sharply to approximately 60 and then fluctuates between 100 and 50 for the remaining letters.
### Key Observations
* The number of argmax values is significantly higher for 'S' compared to other letters.
* The values are relatively low and stable for most letters, except for 'B' and 'S'.
* The annotation "argmax: S" highlights the peak at 'S'.
### Interpretation
The chart suggests that the letter 'S' is the most frequent argmax value among the tested ASCII characters. This could indicate that 'S' is the "Secret" being referred to in the legend "GT of Secret: S". The data implies a strong bias or preference towards the letter 'S' in the argmax selection process. The other letters have relatively low and similar argmax counts, suggesting they are less significant in the context of this data. The peak at 'S' is a notable outlier, indicating a special role or significance for this particular character.