## Chart: F1-Score Comparison Across Audio Classification Models
### Overview
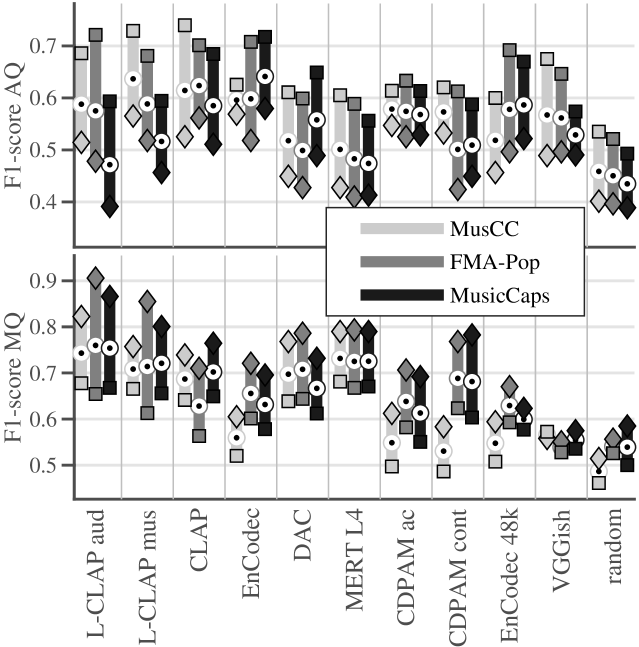
The image presents a dual-axis bar chart comparing F1-scores for audio classification models across two metrics: "F1-score AQ" (top subplot) and "F1-score MQ" (bottom subplot). Three datasets are compared: MusCC (light gray), FMA-Pop (dark gray), and MusicCaps (black). The x-axis lists 11 audio classification models or categories, while the y-axis ranges from 0.4 to 0.9 for F1-score AQ and 0.5 to 0.9 for F1-score MQ.
### Components/Axes
- **X-axis (Models/Categories)**:
L-CLAP aud, L-CLAP mus, CLAP, EnCodec, DAC, MERT L4, CDPAM ac, CDPAM cont, EnCodec 48k, VGGish, random
- **Y-axis (F1-score)**:
Top subplot: 0.4–0.9 (F1-score AQ)
Bottom subplot: 0.5–0.9 (F1-score MQ)
- **Legend**:
- MusCC: Light gray squares
- FMA-Pop: Dark gray diamonds
- MusicCaps: Black circles
### Detailed Analysis
#### Top Subplot (F1-score AQ)
- **Trend**: All datasets show moderate performance, with scores clustered between 0.5 and 0.7.
- **Key Data Points**:
- **L-CLAP aud**: MusCC (~0.62), FMA-Pop (~0.65), MusicCaps (~0.68)
- **EnCodec**: MusCC (~0.60), FMA-Pop (~0.63), MusicCaps (~0.66)
- **VGGish**: MusCC (~0.55), FMA-Pop (~0.58), MusicCaps (~0.61)
- **Random**: MusCC (~0.45), FMA-Pop (~0.48), MusicCaps (~0.50)
#### Bottom Subplot (F1-score MQ)
- **Trend**: Scores are generally higher (0.6–0.8), with MusicCaps consistently outperforming others.
- **Key Data Points**:
- **CLAP**: MusCC (~0.72), FMA-Pop (~0.75), MusicCaps (~0.78)
- **DAC**: MusCC (~0.70), FMA-Pop (~0.73), MusicCaps (~0.76)
- **EnCodec 48k**: MusCC (~0.68), FMA-Pop (~0.71), MusicCaps (~0.74)
- **Random**: MusCC (~0.55), FMA-Pop (~0.58), MusicCaps (~0.60)
### Key Observations
1. **MusicCaps Dominance**: MusicCaps achieves the highest F1-scores in both subplots, particularly in F1-score MQ (e.g., 0.78 for CLAP).
2. **VGGish Underperformance**: VGGish scores the lowest across most categories, with F1-score AQ dropping to ~0.55.
3. **Random Baseline**: The "random" category serves as a lower bound, with scores ~0.45–0.60.
4. **Subplot Divergence**: F1-score MQ values are consistently higher than F1-score AQ, suggesting MQ metric is less stringent.
### Interpretation
The data suggests **MusicCaps** is the most robust audio classification model across all categories, likely due to its specialized training on MusicCaps dataset. **VGGish** struggles with lower scores, indicating potential limitations in feature extraction for these tasks. The **F1-score MQ** metric appears more lenient, as its range starts at 0.5 compared to 0.4 for F1-score AQ.
Notably, **EnCodec 48k** and **DAC** show strong performance in F1-score MQ (~0.71–0.76), suggesting they handle MQ tasks effectively despite moderate AQ scores. The "random" category’s performance highlights the baseline difficulty of the classification tasks.
The spatial grounding of the legend (center-right) and consistent symbol-color alignment confirm data integrity. No anomalies are observed beyond expected performance variations.