## Bar Chart: Pass Rate vs. Mid-Training Tokens
### Overview
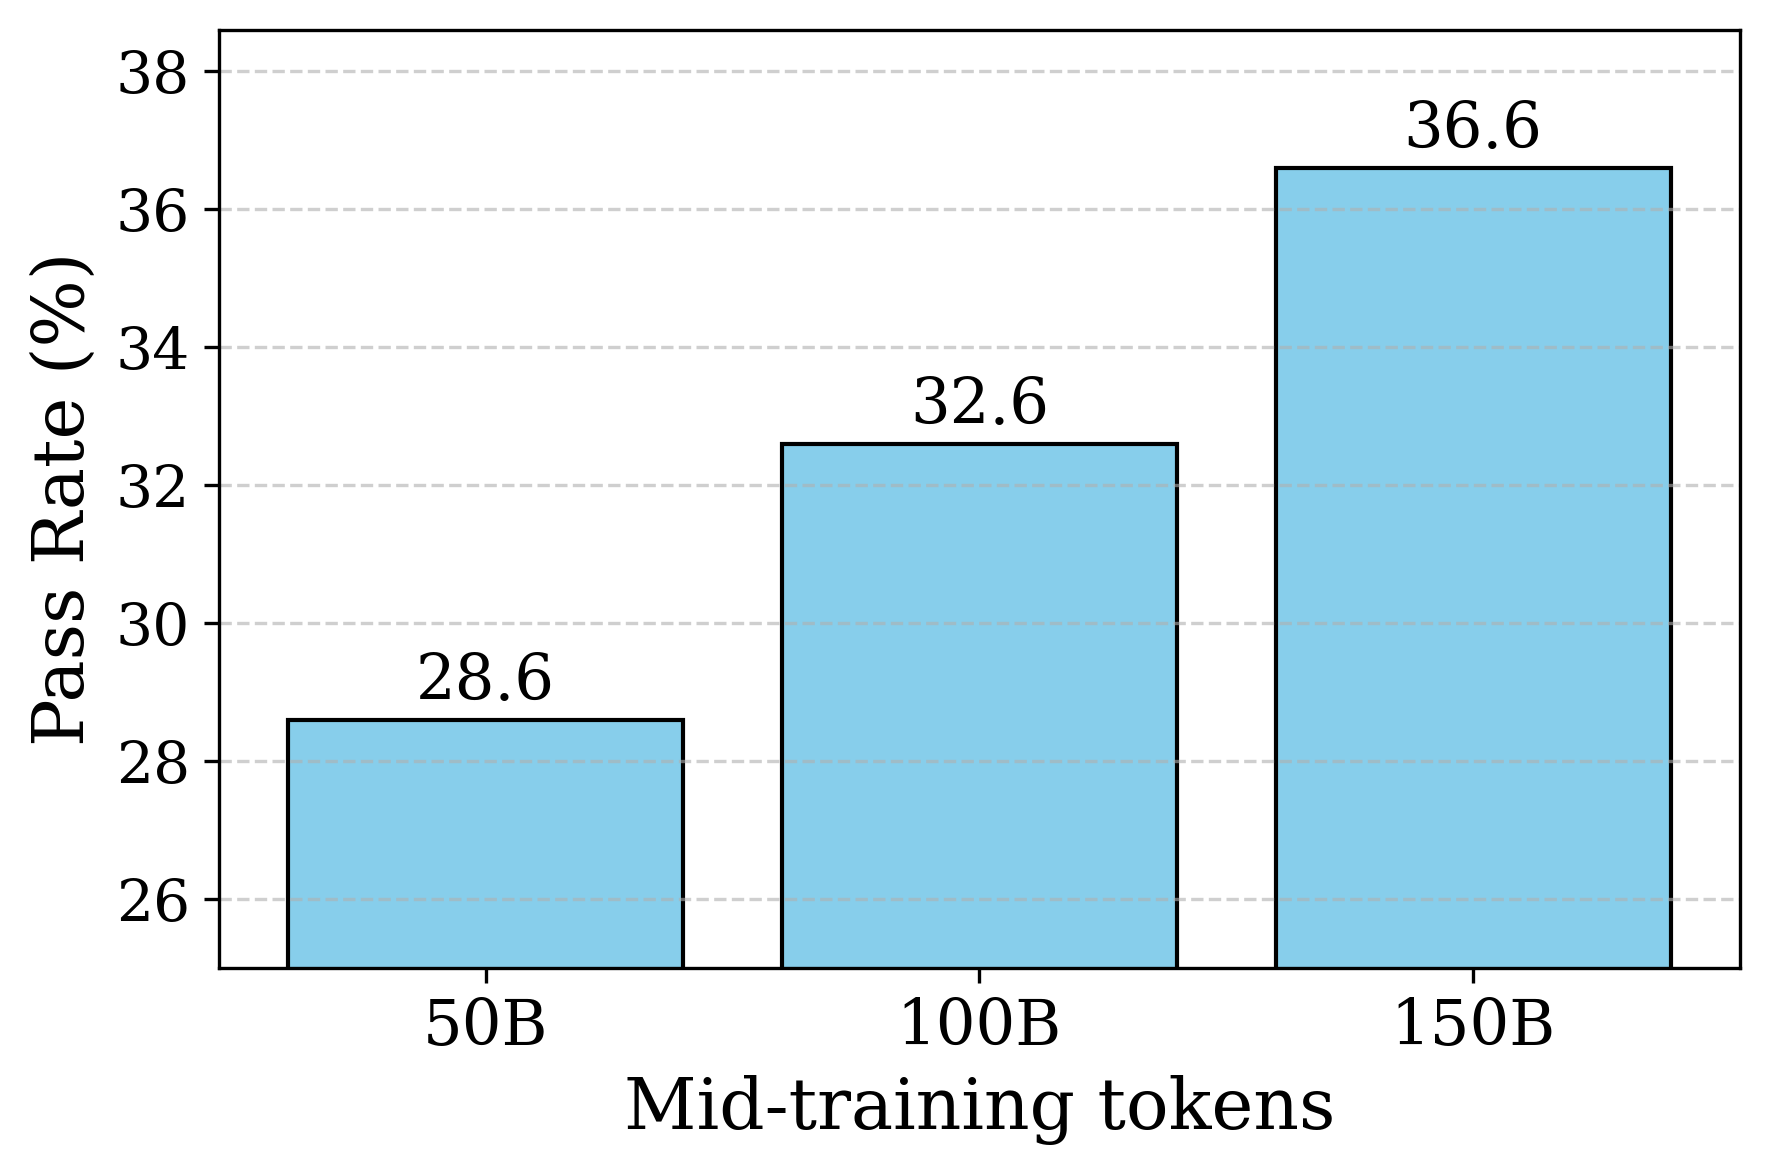
The image is a bar chart illustrating the relationship between "Mid-training tokens" and "Pass Rate (%)". The x-axis represents the number of mid-training tokens (50B, 100B, 150B), and the y-axis represents the pass rate in percentage. The chart shows an increasing trend in pass rate as the number of mid-training tokens increases.
### Components/Axes
* **X-axis:** "Mid-training tokens" with values 50B, 100B, and 150B.
* **Y-axis:** "Pass Rate (%)" ranging from 26 to 38, with gridlines at intervals of 2.
* **Bars:** Three light blue bars representing the pass rate for each mid-training token value.
* **Values:** Numerical values are displayed above each bar, indicating the exact pass rate.
### Detailed Analysis
* **50B Mid-training tokens:** Pass Rate = 28.6%
* **100B Mid-training tokens:** Pass Rate = 32.6%
* **150B Mid-training tokens:** Pass Rate = 36.6%
The pass rate increases as the number of mid-training tokens increases.
### Key Observations
* The pass rate increases consistently with the increase in mid-training tokens.
* The increase in pass rate from 50B to 100B is 4% (32.6 - 28.6).
* The increase in pass rate from 100B to 150B is 4% (36.6 - 32.6).
### Interpretation
The chart suggests a positive correlation between the number of mid-training tokens and the pass rate. Increasing the number of mid-training tokens leads to a higher pass rate, indicating improved model performance. The consistent increase of 4% between each data point suggests a linear relationship within the observed range. This implies that further increasing the number of mid-training tokens might continue to improve the pass rate, although this cannot be definitively concluded without additional data points.