## Bar Chart: Pass Rate vs. Mid-training Tokens
### Overview
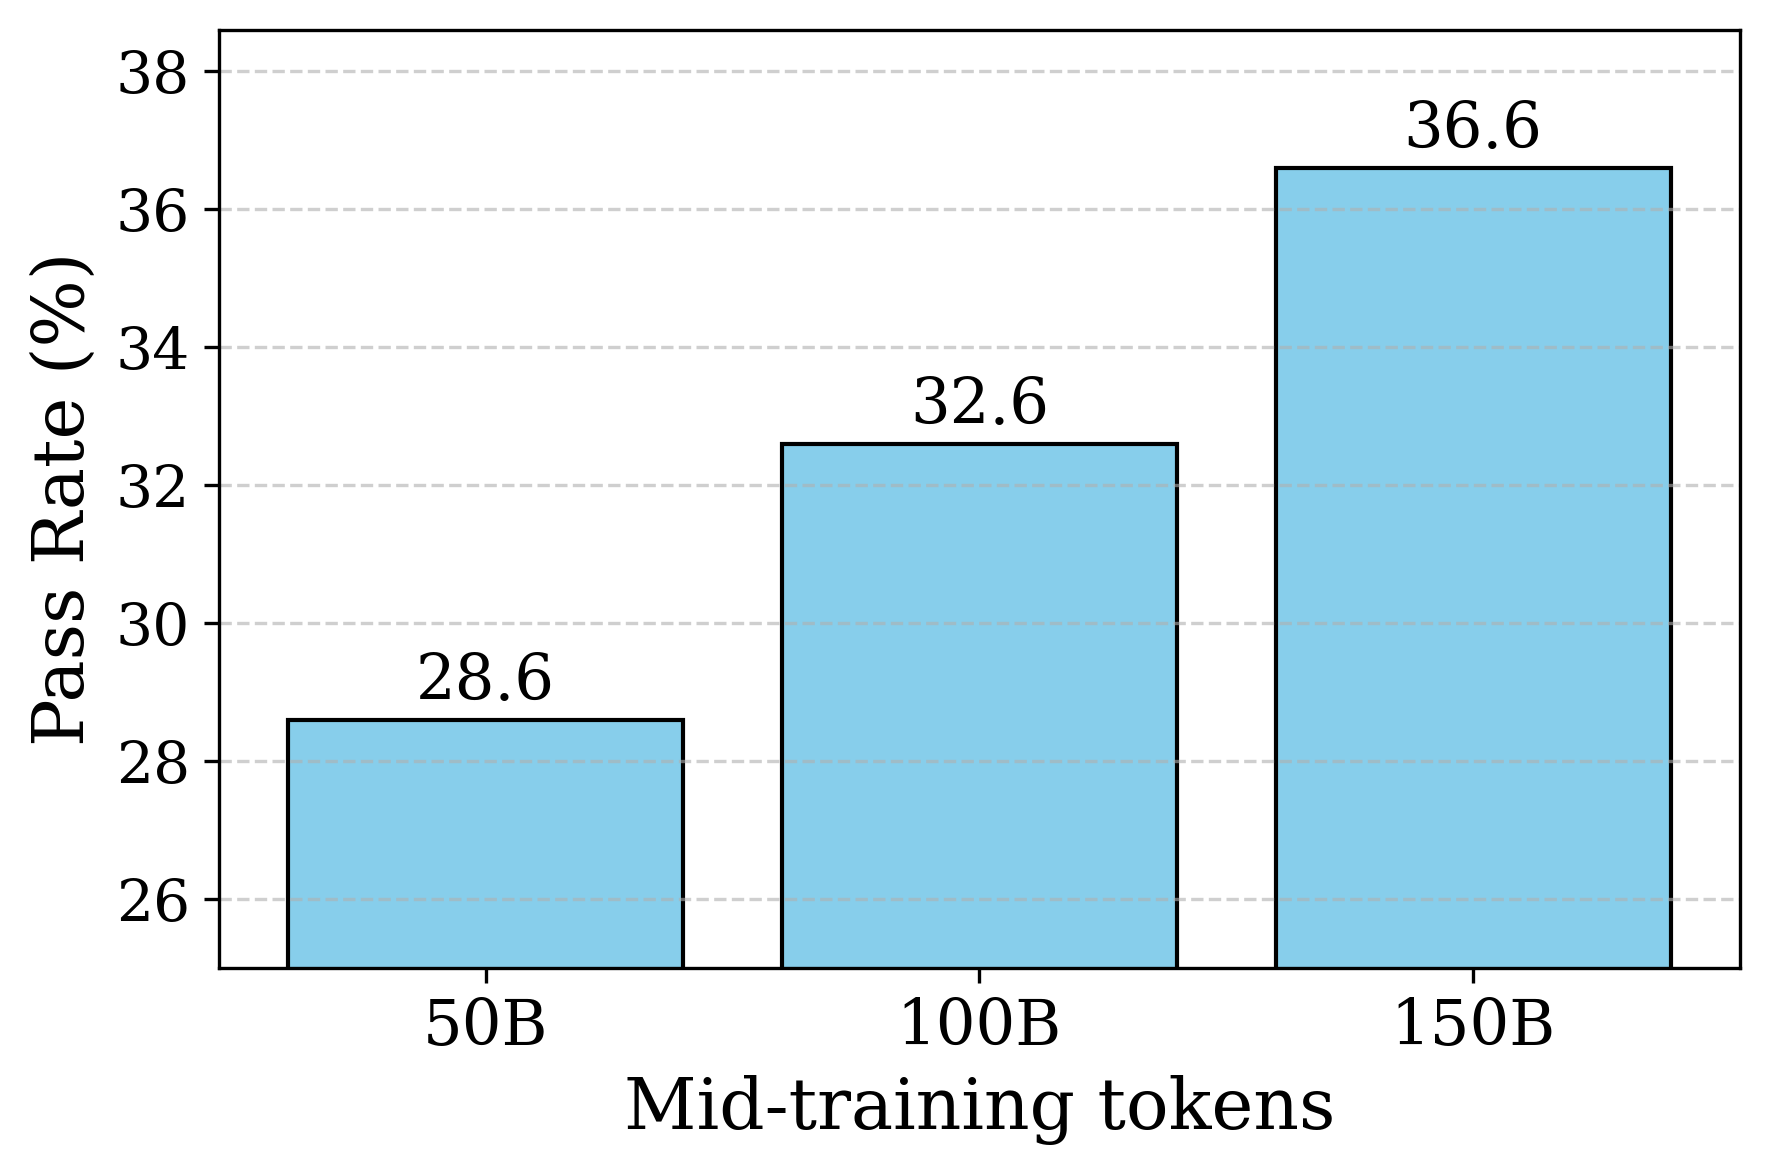
This is a vertical bar chart illustrating the relationship between the number of "Mid-training tokens" (in billions) and the resulting "Pass Rate" (as a percentage). The chart demonstrates a clear, positive correlation: as the number of mid-training tokens increases, the pass rate also increases.
### Components/Axes
* **Chart Type:** Vertical Bar Chart.
* **Y-Axis (Vertical):**
* **Label:** "Pass Rate (%)"
* **Scale:** Linear scale ranging from 26 to 38, with major tick marks and grid lines at intervals of 2 units (26, 28, 30, 32, 34, 36, 38).
* **X-Axis (Horizontal):**
* **Label:** "Mid-training tokens"
* **Categories:** Three discrete categories representing token counts: "50B", "100B", and "150B".
* **Data Series:** A single data series represented by three light blue bars with black outlines.
* **Data Labels:** Each bar has its exact numerical value displayed directly above it.
* **Legend:** Not present in this chart.
* **Title:** No chart title is present.
### Detailed Analysis
The chart presents three data points, each corresponding to a specific mid-training token count:
1. **50B Tokens:**
* **Bar Position:** Leftmost bar.
* **Pass Rate Value:** 28.6%
* **Visual Trend:** The shortest bar, establishing the baseline performance.
2. **100B Tokens:**
* **Bar Position:** Center bar.
* **Pass Rate Value:** 32.6%
* **Visual Trend:** The bar is taller than the 50B bar, indicating an increase in pass rate. The increase from 50B to 100B is 4.0 percentage points.
3. **150B Tokens:**
* **Bar Position:** Rightmost bar.
* **Pass Rate Value:** 36.6%
* **Visual Trend:** The tallest bar, showing the highest performance. The increase from 100B to 150B is another 4.0 percentage points.
**Trend Verification:** The visual trend is unambiguously upward. Each successive bar to the right is taller than the previous one, confirming a monotonic increase in pass rate with more mid-training tokens.
### Key Observations
* **Consistent Linear Increase:** The pass rate increases by a consistent margin of 4.0 percentage points for each 50-billion-token increment in mid-training data (from 50B to 100B, and from 100B to 150B).
* **No Plateau Observed:** Within the range shown (50B to 150B tokens), there is no visual indication of diminishing returns or a performance plateau. The growth appears linear.
* **Clear Positive Correlation:** The relationship between the two variables is direct and positive.
* **Absence of Outliers:** All data points follow the established trend perfectly.
### Interpretation
The data suggests a strong, positive, and linear relationship between the volume of mid-training tokens and the model's performance on the evaluated task (measured by pass rate). This implies that, within the tested range, investing in more mid-training data yields proportional improvements in model capability.
From a technical perspective, this chart likely comes from an AI/ML research context, evaluating how scaling the "mid-training" phase (a stage between initial pre-training and final fine-tuning) affects final model performance. The consistent 4% gain per 50B tokens provides a predictable scaling law for this specific training regimen and evaluation metric. The key takeaway is that increasing mid-training data is an effective strategy for boosting model pass rates, with no observed saturation point up to 150B tokens.