# Technical Document Extraction: Bar Chart Analysis
## Chart Type
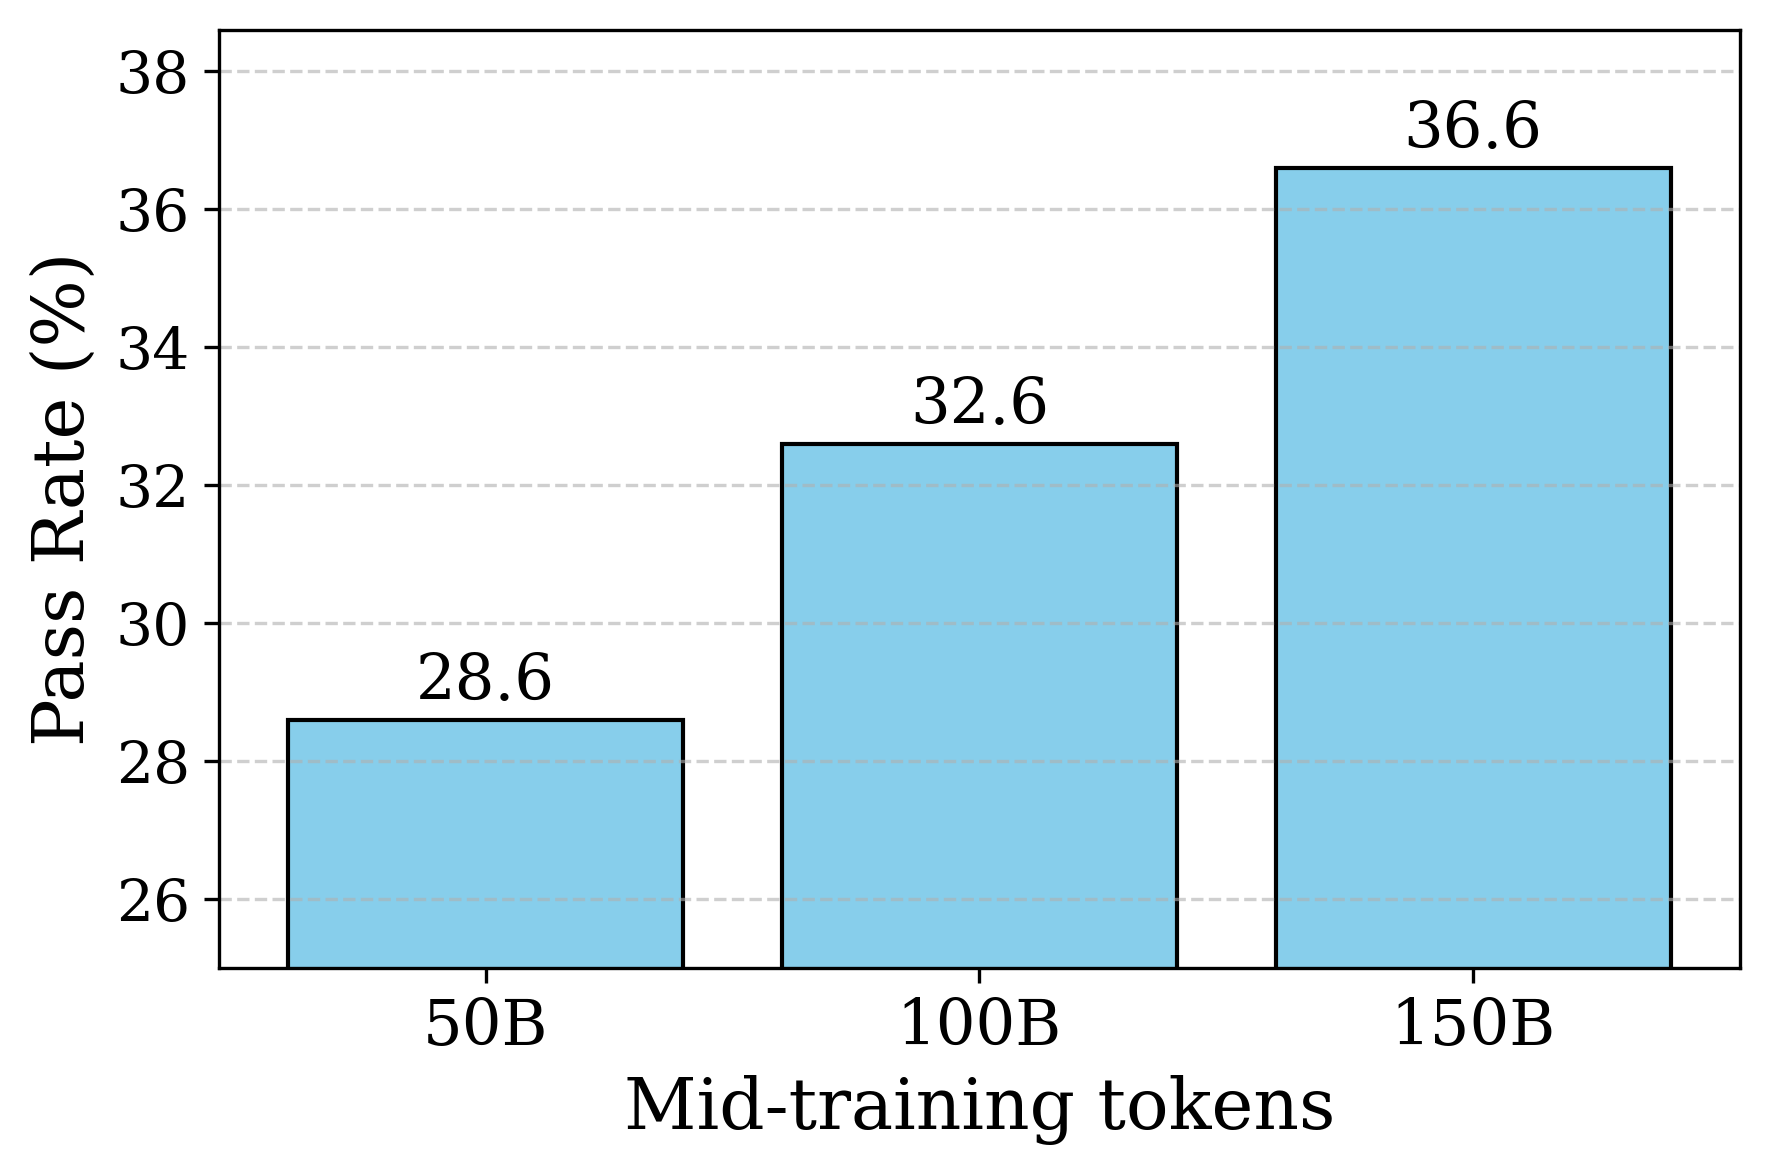
- **Bar Chart** with vertical orientation.
## Axes
- **X-Axis (Horizontal)**:
- Label: *"Mid-training tokens"*
- Categories:
- `50B` (28.6%)
- `100B` (32.6%)
- `150B` (36.6%)
- Tick Marks: Positioned below each bar.
- **Y-Axis (Vertical)**:
- Label: *"Pass Rate (%)"*
- Range: 26% to 38% (inclusive).
- Tick Intervals: 2% increments (26%, 28%, ..., 38%).
- Grid Lines: Dashed horizontal lines across the chart.
## Data Points
| Mid-training Tokens | Pass Rate (%) |
|---------------------|---------------|
| 50B | 28.6 |
| 100B | 32.6 |
| 150B | 36.6 |
## Trends
- **Increasing Trend**: Pass rate rises monotonically as mid-training tokens increase.
- From `50B` (28.6%) to `100B` (32.6%): +4% improvement.
- From `100B` (32.6%) to `150B` (36.6%): +4% improvement.
## Visual Components
- **Bars**:
- Color: Light blue (`#ADD8E6`).
- Outline: Black.
- Height: Proportional to pass rate values.
- **Grid**: Dashed gray lines for reference.
- **Background**: White.
## Legend
- **Absent**: No explicit legend present. All bars share the same color, implying a single data series.
## Spatial Grounding
- **X-Axis**: Centered below the chart.
- **Y-Axis**: Left-aligned, extending vertically.
- **Bars**: Positioned above their respective x-axis labels.
## Component Isolation
1. **Header**: None.
2. **Main Chart**: Three bars with grid lines.
3. **Footer**: None.
## Notes
- No textual annotations or additional data tables present.
- All values are explicitly labeled on the bars.
- No secondary axes or annotations detected.