## 3D Scatter Plot: Latent Tokens vs Vocab Tokens
### Overview
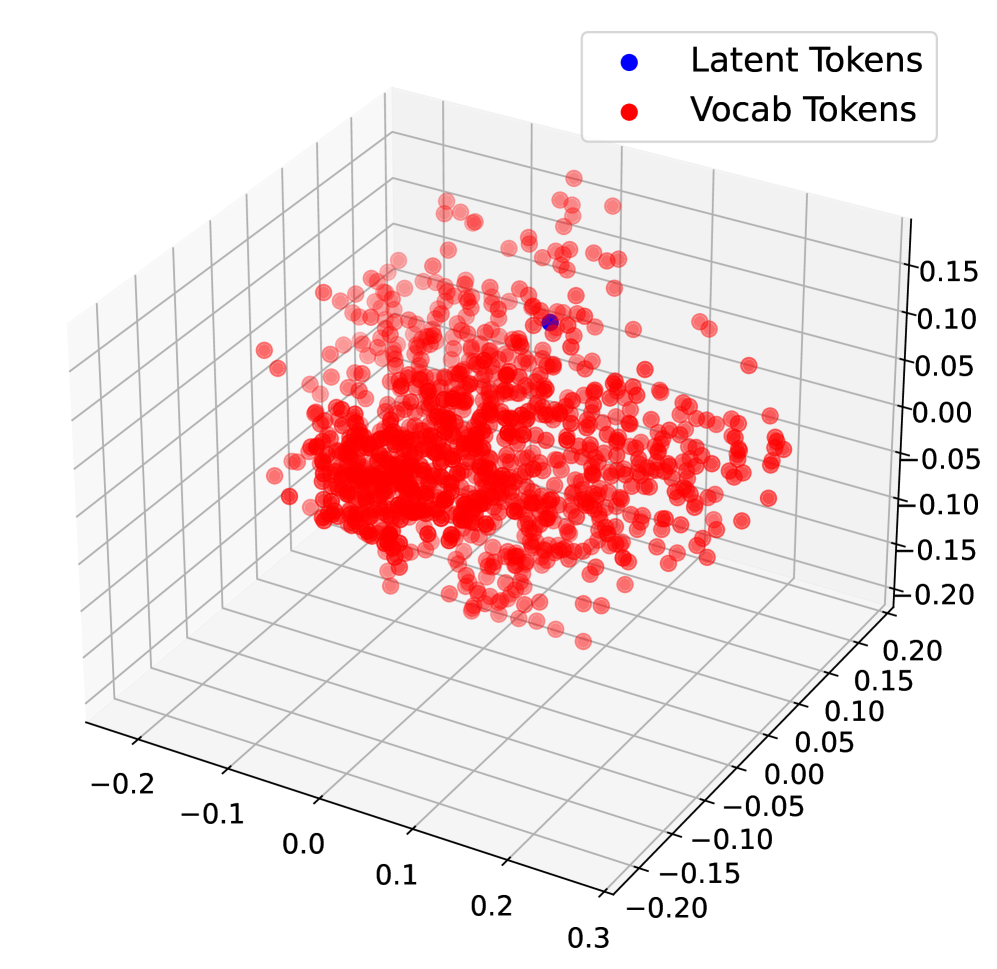
The image is a 3D scatter plot visualizing the distribution of "Latent Tokens" and "Vocab Tokens". The plot displays data points in a three-dimensional space, with the x, y, and z axes ranging from approximately -0.2 to 0.3, -0.2 to 0.2, and -0.2 to 0.15, respectively. "Latent Tokens" are represented by a single blue data point, while "Vocab Tokens" are represented by numerous red data points.
### Components/Axes
* **X-axis:** Ranges from -0.2 to 0.3, with tick marks at -0.2, -0.1, 0.0, 0.1, 0.2, and 0.3.
* **Y-axis:** Ranges from -0.2 to 0.2, with tick marks at -0.2, -0.15, -0.1, -0.05, 0.0, 0.05, 0.1, 0.15, and 0.2.
* **Z-axis:** Ranges from -0.2 to 0.15, with tick marks at -0.2, -0.15, -0.1, -0.05, 0.0, 0.05, 0.1, and 0.15.
* **Legend (Top-Right):**
* Blue dot: "Latent Tokens"
* Red dot: "Vocab Tokens"
### Detailed Analysis
* **Latent Tokens:** Represented by a single blue data point located approximately at (0.1, 0.1, 0.1).
* **Vocab Tokens:** Represented by a cluster of red data points. The majority of these points are concentrated in the region where the x-axis ranges from 0.0 to 0.2, the y-axis ranges from -0.1 to 0.1, and the z-axis ranges from -0.1 to 0.1. There are also some scattered red points extending beyond this central cluster.
### Key Observations
* The "Vocab Tokens" are densely clustered, indicating a high degree of similarity or co-occurrence among these tokens in the three-dimensional space.
* The single "Latent Token" is positioned outside the main cluster of "Vocab Tokens", suggesting it has distinct characteristics or a different context compared to the vocabulary tokens.
### Interpretation
The 3D scatter plot visualizes the relationship between "Latent Tokens" and "Vocab Tokens" in a high-dimensional space, reduced to three dimensions for visualization. The clustering of "Vocab Tokens" suggests that these tokens share common features or contexts, while the isolated position of the "Latent Token" indicates it may represent a more abstract or less frequent concept. This visualization could be used to understand the semantic relationships between different types of tokens in a natural language processing model or to identify outliers in a dataset. The plot suggests that the latent token is distinct from the vocabulary tokens, potentially representing a higher-level abstraction or a less common term.