\n
## 3D Scatter Plot: Latent vs. Vocab Tokens
### Overview
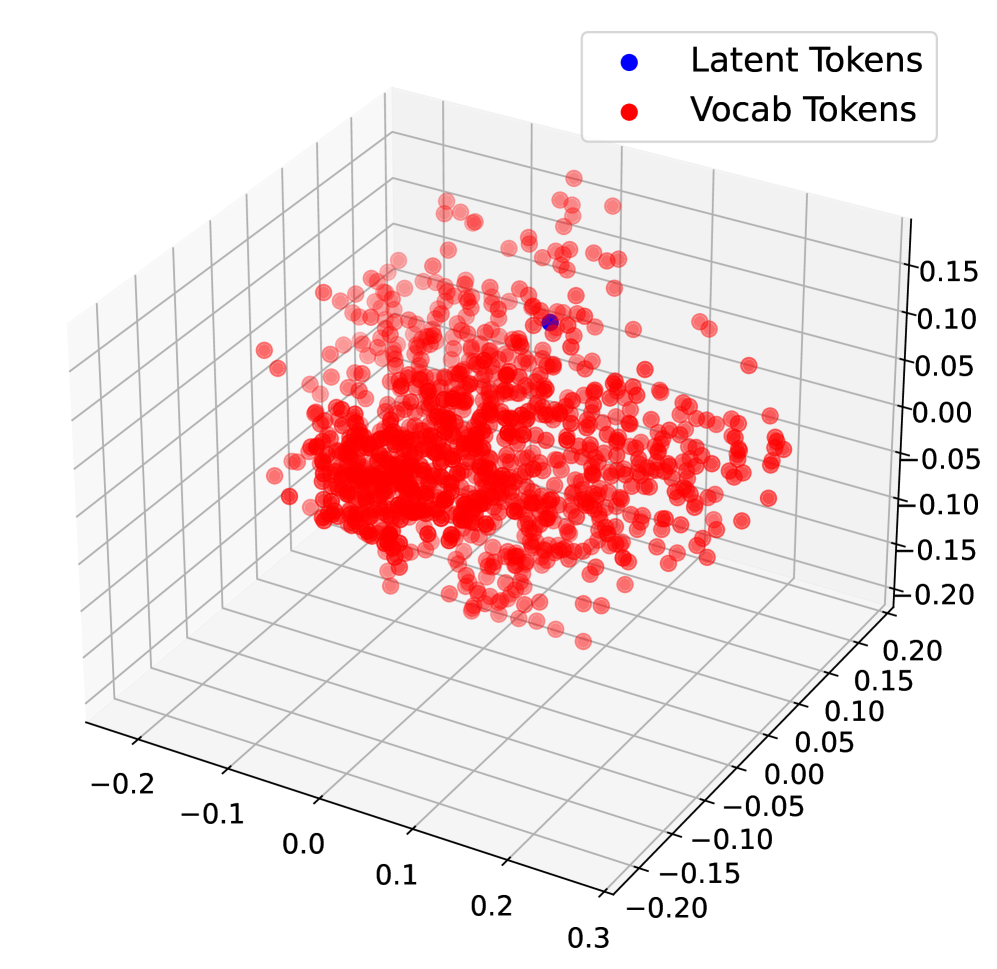
The image presents a 3D scatter plot visualizing the distribution of "Latent Tokens" and "Vocab Tokens" in a three-dimensional space. The plot uses a Cartesian coordinate system with three axes, and data points are represented by colored spheres. The majority of the points are red, representing "Vocab Tokens", while a smaller number of blue points represent "Latent Tokens".
### Components/Axes
* **X-axis:** Ranges approximately from -0.2 to 0.3.
* **Y-axis:** Ranges approximately from -0.15 to 0.2.
* **Z-axis:** Ranges approximately from -0.05 to 0.15.
* **Legend:** Located in the top-right corner.
* Blue: "Latent Tokens"
* Red: "Vocab Tokens"
* **Data Points:** Spherical markers representing individual tokens.
### Detailed Analysis
The plot shows a dense cluster of red points ("Vocab Tokens") concentrated around the origin (approximately x=0, y=0, z=0). The distribution appears roughly spherical, though slightly elongated along the x-axis. The blue points ("Latent Tokens") are sparsely distributed throughout the space, with a tendency to be located further from the origin than the red points.
Let's analyze the approximate coordinates of some points:
* **Vocab Tokens (Red):**
* A large number of points cluster around (x=0.05, y=-0.05, z=0.05).
* Points extend to approximately (x=0.25, y=0.1, z=0.1).
* Points extend to approximately (x=-0.15, y=-0.1, z=-0.05).
* **Latent Tokens (Blue):**
* A few points are visible around (x=0.2, y=0.15, z=0.1).
* A few points are visible around (x=-0.15, y=-0.1, z=0.1).
* A few points are visible around (x=0.1, y=-0.1, z=0.05).
The density of red points is significantly higher than that of blue points. The red points are more tightly clustered around the origin, while the blue points are more scattered.
### Key Observations
* The "Vocab Tokens" are far more numerous than the "Latent Tokens".
* "Vocab Tokens" are generally closer to the origin than "Latent Tokens".
* The distribution of "Vocab Tokens" is relatively compact, while the distribution of "Latent Tokens" is more dispersed.
* There is some overlap in the spatial distribution of the two token types, but the majority of "Vocab Tokens" occupy a distinct region near the origin.
### Interpretation
This visualization likely represents an embedding space where tokens are mapped to three-dimensional vectors. The "Vocab Tokens" likely represent words or sub-word units from a vocabulary, while the "Latent Tokens" might represent hidden or abstract concepts learned by a model.
The clustering of "Vocab Tokens" near the origin suggests that these tokens are generally more common or have more conventional meanings. The more dispersed distribution of "Latent Tokens" indicates that these tokens represent more abstract or less frequent concepts. The separation between the two token types suggests that the model has learned to distinguish between concrete vocabulary items and more abstract latent representations.
The relative scarcity of "Latent Tokens" could indicate that the model relies more heavily on the vocabulary for its representations, or that the latent space is still under-developed. The fact that some "Latent Tokens" are located further from the origin than the "Vocab Tokens" suggests that these latent concepts are distinct and potentially important for the model's understanding.
The plot provides a visual representation of the semantic relationships between tokens, allowing for an intuitive understanding of the model's internal representations.