## 3D Scatter Plot: Distribution of Latent and Vocabulary Tokens
### Overview
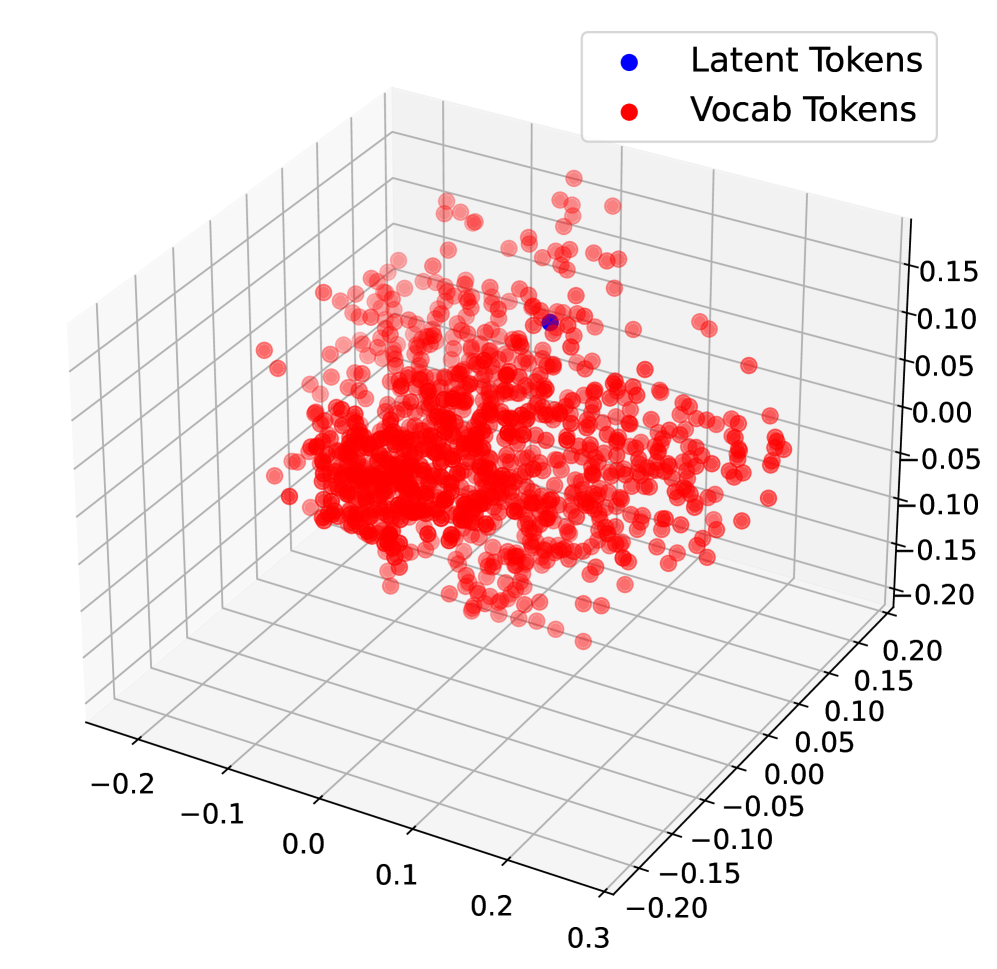
This image is a 3D scatter plot visualizing the spatial distribution of two types of tokens within a three-dimensional embedding space. The plot compares the positions of "Latent Tokens" and "Vocab Tokens" to illustrate their relationship and clustering characteristics.
### Components/Axes
* **Legend:** Located in the top-right corner. It defines two data series:
* **Latent Tokens:** Represented by blue dots.
* **Vocab Tokens:** Represented by red dots.
* **Axes:** The plot features three orthogonal axes forming a 3D grid. The axes are not explicitly labeled with descriptive titles (e.g., "Dimension 1," "Component A"), but are marked with numerical scales.
* **X-axis (Front-Left to Back-Right):** Scale ranges from approximately -0.2 to 0.3.
* **Y-axis (Front-Right to Back-Left):** Scale ranges from approximately -0.20 to 0.20.
* **Z-axis (Vertical):** Scale ranges from approximately -0.20 to 0.15.
* **Grid:** A light gray grid is present on all three planes (XY, XZ, YZ) to aid in spatial orientation.
### Detailed Analysis
* **Vocab Tokens (Red):** This series constitutes the vast majority of the data points. The red dots form a large, dense, and roughly spherical or ellipsoidal cluster centered near the origin (0, 0, 0) of the 3D space. The cluster has a high density in its core, with points becoming more sparse towards the periphery. The overall spread covers a significant portion of the plotted volume, roughly from -0.15 to +0.25 on the X-axis, -0.15 to +0.15 on the Y-axis, and -0.15 to +0.10 on the Z-axis.
* **Latent Token (Blue):** There is a single, distinct blue dot visible. It is located within the general volume of the red cluster but is clearly isolated. Its approximate position is near coordinates (X: ~0.05, Y: ~0.05, Z: ~0.05). It does not appear to be part of the dense core of the Vocab Token cluster.
### Key Observations
1. **Extreme Class Imbalance:** The visualization is dominated by Vocab Tokens, with only one Latent Token shown. This suggests the plot is either a sample highlighting a specific latent token's position relative to the vocabulary, or that latent tokens are exceedingly rare in this particular projection.
2. **Spatial Relationship:** The single Latent Token resides within the spatial bounds defined by the Vocab Tokens but is not embedded within their highest-density region. It occupies a more peripheral location.
3. **Cluster Morphology:** The Vocab Tokens form a cohesive, cloud-like cluster without obvious sub-clusters or distinct branches in this 3D view. The distribution appears continuous.
### Interpretation
This plot likely visualizes embeddings from a neural language model or a similar system. The "Vocab Tokens" represent the vector embeddings for words or subwords from the model's standard vocabulary. The "Latent Token" likely represents a special, non-vocabulary token—such as a control code, a task-specific marker, or a vector from a model's internal latent space.
The key insight is the **positional relationship**: the latent token is embedded within the same continuous vector space as the vocabulary tokens, suggesting it is processed by the model using similar geometric operations. However, its location away from the dense core of common vocabulary embeddings might indicate it has a distinct functional role or a less frequent, more specialized meaning. The visualization demonstrates that latent and vocabulary representations coexist in a shared embedding space, which is fundamental for models that interleave special tokens with standard text. The dense clustering of vocab tokens reflects the model's learned semantic similarity, where many words are close neighbors in this abstract space.