\n
## Flow Diagram: PRISMA Flow Diagram - Study Selection
### Overview
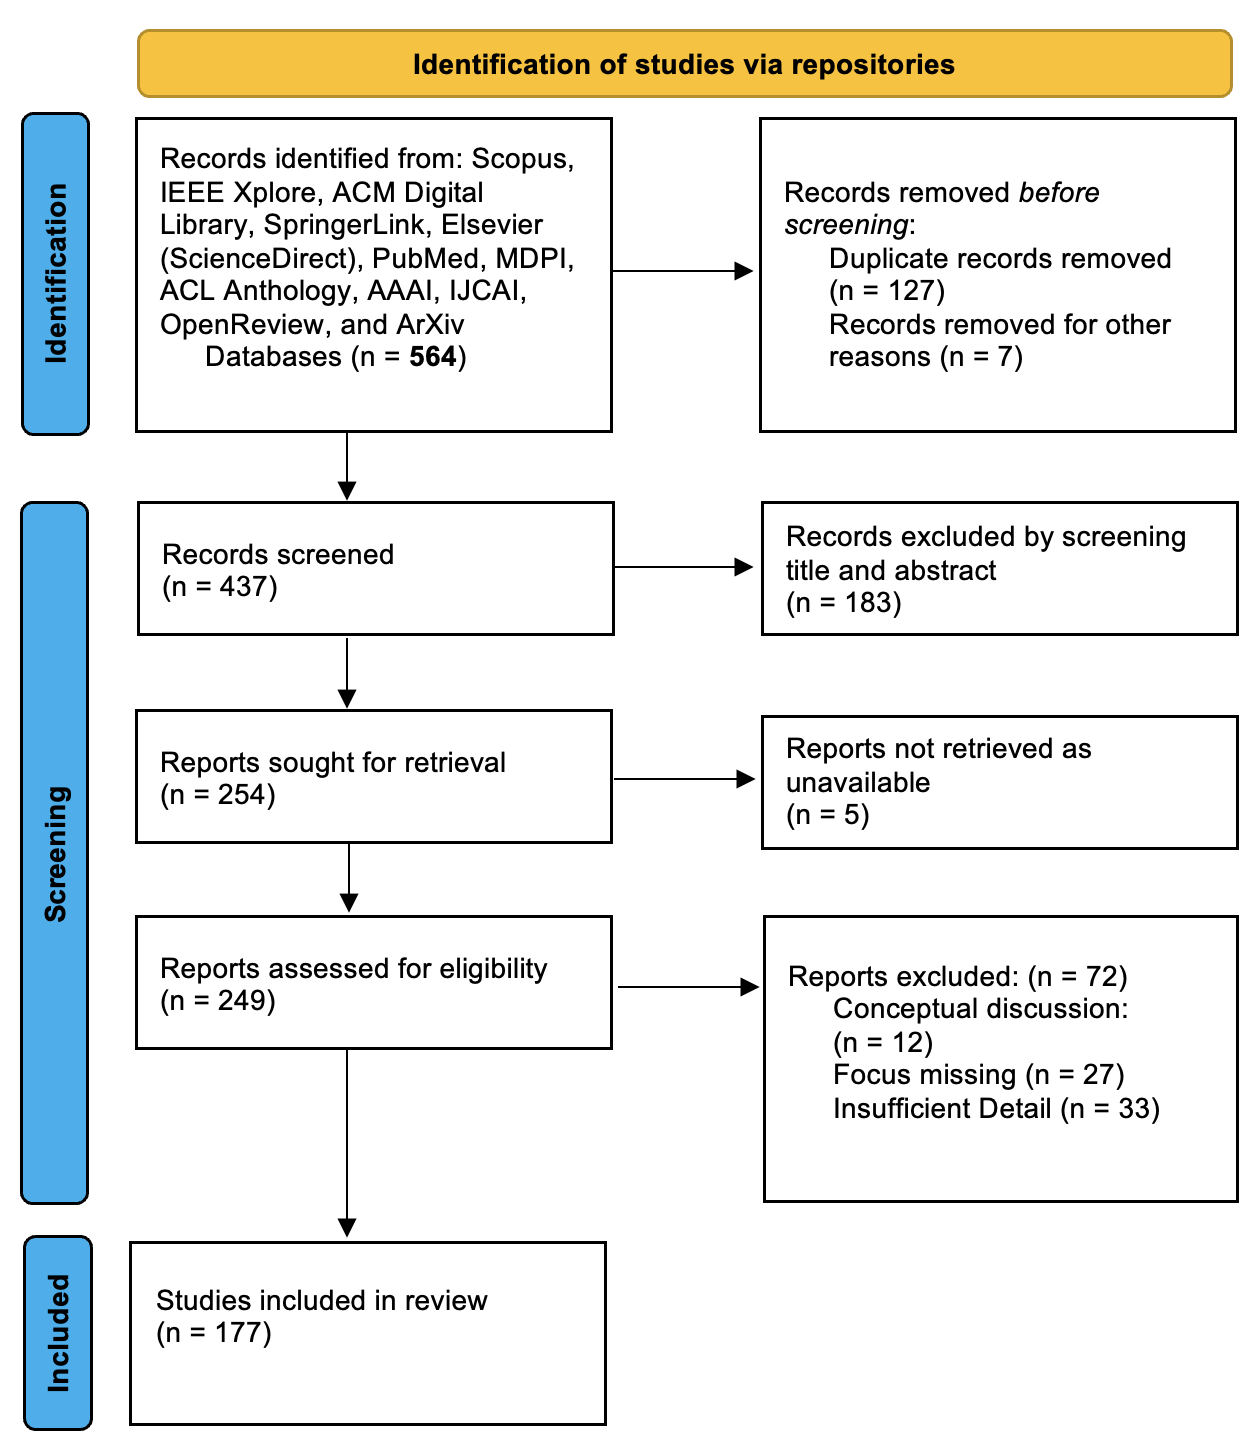
This image presents a PRISMA (Preferred Reporting Items for Systematic Reviews and Meta-Analyses) flow diagram illustrating the study selection process. It visually depicts the number of records identified, screened, assessed, and ultimately included in a review. The diagram flows from top to bottom, representing the stages of the review process.
### Components/Axes
The diagram is structured into three main sections: "Identification", "Screening", and "Included", arranged vertically. Each section contains rectangular boxes representing stages and arrows indicating the flow of records. Each box contains a textual description of the stage and the number of records (n = x) at that stage. There are also boxes to the right of each stage indicating records removed or excluded, with reasons provided.
### Detailed Analysis or Content Details
**Identification:**
* **Records identified from:** Scopus, IEEE Xplore, ACM Digital Library, SpringerLink, Elsevier (ScienceDirect), PubMed, MDPI, ACL Anthology, AAAI, IJCAI, OpenReview, and ArXiv Databases (n = 564)
* **Records removed before screening:**
* Duplicate records removed (n = 127)
* Records removed for other reasons (n = 7)
**Screening:**
* **Records screened:** (n = 437)
* **Records excluded by screening title and abstract:** (n = 183)
* **Reports sought for retrieval:** (n = 254)
* **Reports not retrieved as unavailable:** (n = 5)
* **Reports assessed for eligibility:** (n = 249)
* **Reports excluded:** (n = 72)
* Conceptual discussion: (n = 12)
* Focus missing: (n = 27)
* Insufficient Detail: (n = 33)
**Included:**
* **Studies included in review:** (n = 177)
The arrows indicate the flow of records through each stage. The diagram uses a consistent color scheme: blue for included records, and white for records removed.
### Key Observations
The initial search identified 564 records. A significant number of records were removed at the initial screening stage due to duplication (127) and other reasons (7). A substantial number of records were excluded after title and abstract screening (183). The final review included 177 studies. The largest reason for exclusion at the eligibility assessment stage was insufficient detail (33).
### Interpretation
This PRISMA flow diagram provides a transparent and systematic account of the study selection process. It demonstrates how the initial pool of identified records was progressively narrowed down to the final set of included studies. The diagram highlights the importance of rigorous screening criteria and the reasons for excluding records at each stage. The large number of records removed at the initial stages suggests the effectiveness of the deduplication process. The reasons for exclusion at the eligibility assessment stage (conceptual discussion, focus missing, insufficient detail) provide valuable insights into the quality and relevance of the included studies. The diagram is a standard component of systematic review methodology, ensuring reproducibility and minimizing bias.