# Technical Document Extraction: Study Identification Flowchart
## Overview
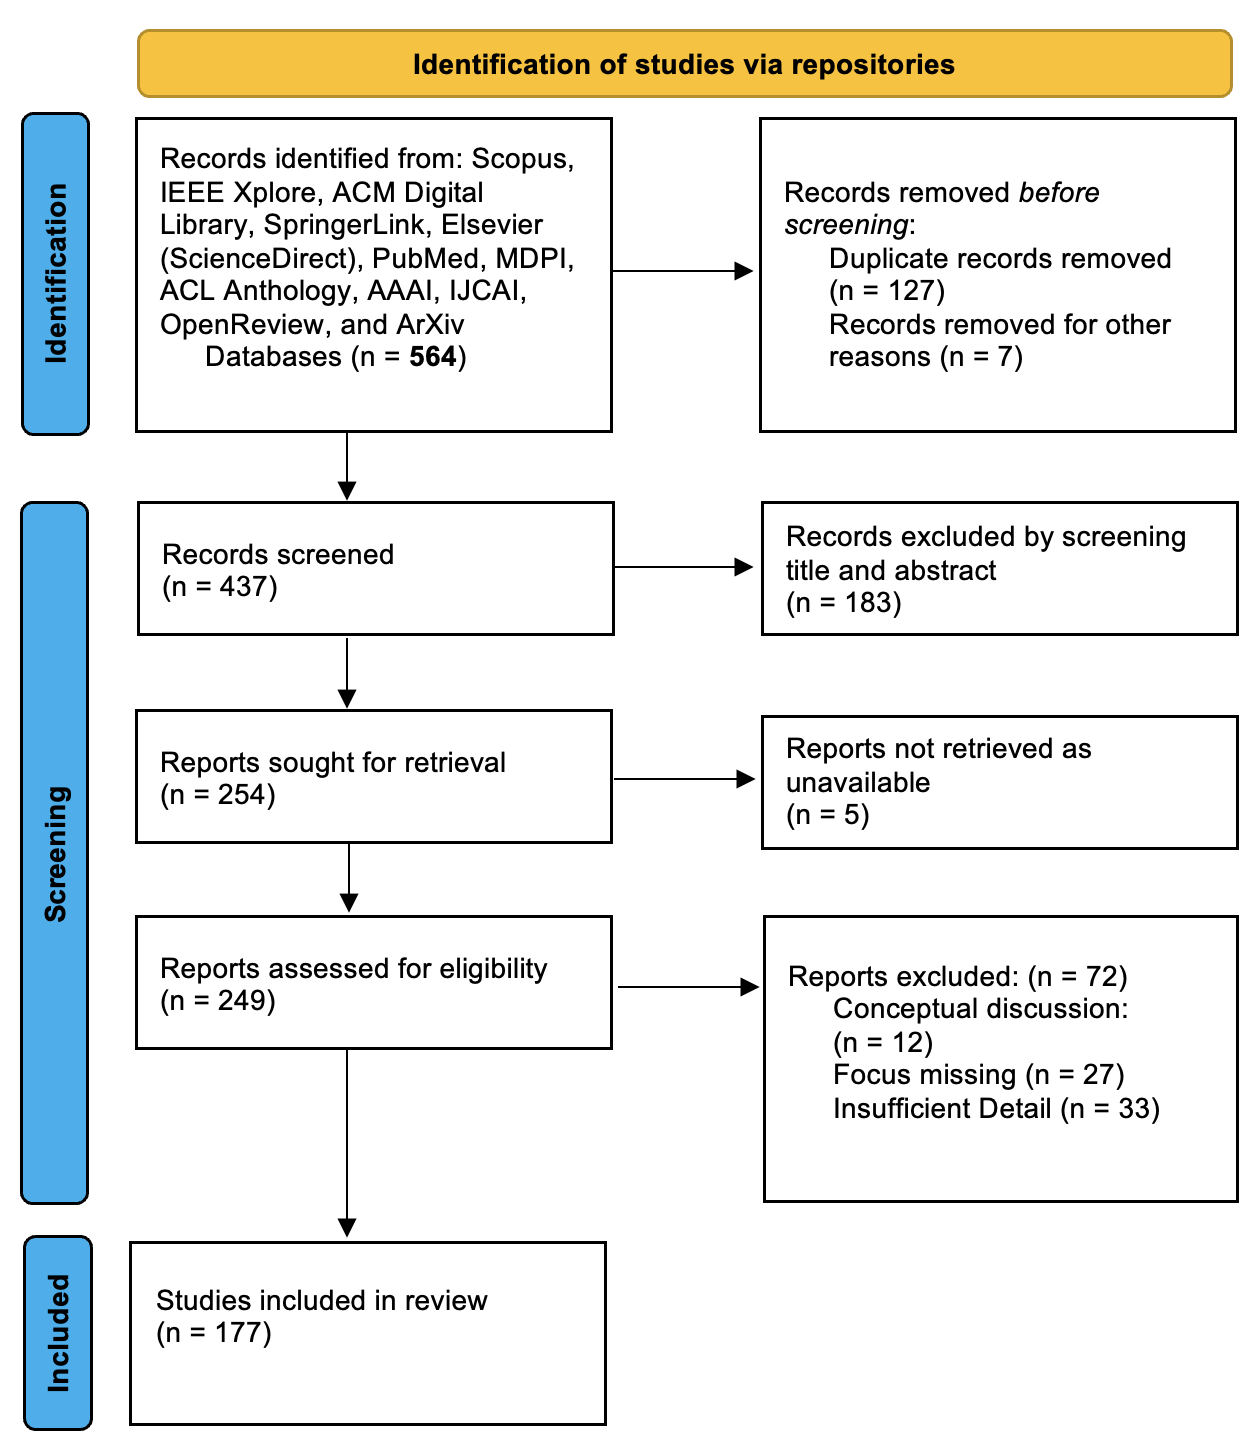
The image depicts a multi-stage process for identifying and screening studies from various repositories. The flowchart is divided into three primary phases: **Identification**, **Screening**, and **Included**. Each phase contains labeled boxes with numerical data and exclusion criteria.
---
## Phase 1: Identification of Studies via Repositories
### Key Components:
1. **Records Identified**
- **Sources**: Scopus, IEEE Xplore, ACM Digital Library, SpringerLink, Elsevier (ScienceDirect), PubMed, MDPI, ACL Anthology, AAAI, IJCAI, OpenReview, ArXiv.
- **Total Records**: `n = 564`
2. **Records Removed Before Screening**
- **Duplicate Records**: `n = 127`
- **Other Reasons**: `n = 7`
- **Total Removed**: `127 + 7 = 134`
---
## Phase 2: Screening
### Key Components:
1. **Records Screened**
- **Total Screened**: `n = 437`
- **Excluded by Screening (Title/Abstract)**: `n = 183`
2. **Reports Sought for Retrieval**
- **Total Retrieved**: `n = 254`
- **Not Retrieved (Unavailable)**: `n = 5`
3. **Reports Assessed for Eligibility**
- **Total Assessed**: `n = 249`
- **Excluded During Assessment**:
- **Conceptual Discussion**: `n = 12`
- **Focus Missing**: `n = 27`
- **Insufficient Detail**: `n = 33`
- **Total Excluded**: `12 + 27 + 33 = 72`
---
## Phase 3: Included Studies
- **Studies Included in Review**: `n = 177`
---
## Data Flow and Numerical Consistency
1. **Initial Records**:
- `564` (Identified) → `437` (Screened)
- **Discrepancy**: `564 - 134 (removed) = 430`, but the flowchart states `437`. This suggests a potential inconsistency in the data flow.
2. **Screening to Assessment**:
- `437` (Screened) → `254` (Retrieved) → `249` (Assessed)
- **Exclusions**: `183 (screening) + 72 (assessment) = 255`
- **Included**: `177`
---
## Legend and Spatial Grounding
- **Legend**: Not explicitly present in the image.
- **Spatial Layout**:
- **Identification Phase**: Top-left box with repository sources.
- **Screening Phase**: Central boxes with exclusion criteria.
- **Included Phase**: Bottom box with final count.
---
## Key Trends and Data Points
- **Highest Exclusion**: Duplicate records (`127`) and insufficient detail during assessment (`33`).
- **Lowest Exclusion**: Records removed for "other reasons" (`7`) and unavailable reports (`5`).
- **Final Inclusion Rate**: `177/564 ≈ 31.4%`
---
## Notes
- **Language**: All text is in English.
- **Potential Error**: Numerical inconsistency between `564 - 134 = 430` (expected screened) vs. `437` (reported screened).
- **Flowchart Structure**: Sequential arrows guide the process from identification to inclusion.
This extraction captures all textual and numerical data as presented in the image, adhering to the specified technical requirements.