## Diagram: Challenges and Limitations
### Overview
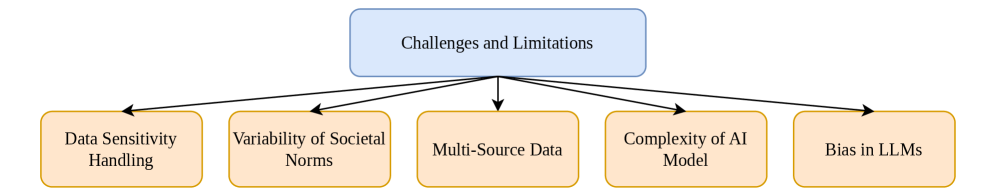
The image is a diagram illustrating the challenges and limitations associated with a central concept. The diagram consists of a central blue rounded rectangle labeled "Challenges and Limitations," which is connected by arrows to five orange rounded rectangles, each representing a specific challenge or limitation.
### Components/Axes
* **Central Node:** A blue rounded rectangle labeled "Challenges and Limitations."
* **Child Nodes:** Five orange rounded rectangles, each connected to the central node by an arrow. The labels of these nodes are:
* "Data Sensitivity Handling"
* "Variability of Societal Norms"
* "Multi-Source Data"
* "Complexity of AI Model"
* "Bias in LLMs"
* **Arrows:** Black arrows connecting the central node to each of the child nodes, indicating a relationship or influence.
### Detailed Analysis or Content Details
The diagram visually represents the relationship between a central topic, "Challenges and Limitations," and five specific challenges or limitations. The arrows indicate that each of the five orange nodes is a challenge or limitation related to the central concept.
* **Data Sensitivity Handling:** Refers to the difficulties and considerations involved in managing and protecting sensitive data.
* **Variability of Societal Norms:** Highlights the challenge of dealing with differing and changing societal norms.
* **Multi-Source Data:** Indicates the complexities associated with integrating and managing data from multiple sources.
* **Complexity of AI Model:** Refers to the challenges arising from the intricate nature of artificial intelligence models.
* **Bias in LLMs:** Points to the issue of bias present in Large Language Models.
### Key Observations
* The diagram is a simple representation of the relationship between a central concept and its associated challenges.
* The use of different colors (blue for the central node and orange for the child nodes) helps to visually distinguish the main topic from its related challenges.
* The arrows clearly indicate the direction of the relationship, showing that the challenges stem from or are related to the central concept.
### Interpretation
The diagram suggests that "Challenges and Limitations" is a broad topic encompassing several specific challenges. The five challenges listed are distinct but related aspects of the overall topic. The diagram is likely used to provide a high-level overview of the challenges associated with a particular field or technology, such as AI or data science. The specific challenges listed (data sensitivity, societal norms, multi-source data, AI model complexity, and bias in LLMs) suggest that the diagram is related to the challenges of developing and deploying AI systems responsibly and ethically.