## Diagram: Challenges and Limitations in AI Systems
### Overview
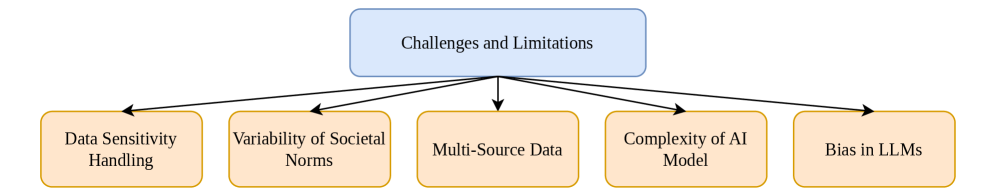
The image is a hierarchical flowchart or tree diagram illustrating the primary "Challenges and Limitations" associated with a complex system, likely related to Artificial Intelligence (AI) or Large Language Models (LLMs). The diagram uses a top-down structure with one central parent node branching into five distinct child nodes.
### Components/Axes
* **Main Node (Parent):** A single, light blue rectangular box positioned at the top-center of the diagram. It contains the title text: **"Challenges and Limitations"**.
* **Sub-Nodes (Children):** Five orange rectangular boxes arranged in a horizontal row below the main node. Each represents a specific challenge.
* **Connectors:** Five black arrows originate from the bottom edge of the main blue box. Each arrow points downward to one of the orange sub-node boxes, indicating a direct, one-to-many relationship. The arrows are evenly spaced, creating a symmetrical fan-out pattern.
### Detailed Analysis
The diagram explicitly lists five key challenges. The text within each component is transcribed below:
1. **Main Node (Top-Center):**
* Text: `Challenges and Limitations`
2. **Sub-Nodes (Left to Right):**
* **Node 1 (Far Left):** `Data Sensitivity Handling`
* **Node 2:** `Variability of Societal Norms`
* **Node 3 (Center):** `Multi-Source Data`
* **Node 4:** `Complexity of AI Model`
* **Node 5 (Far Right):** `Bias in LLMs`
### Key Observations
* **Structure:** The diagram employs a simple, clear hierarchical tree structure to categorize challenges under a single umbrella concept.
* **Visual Coding:** Color is used to distinguish hierarchy: light blue for the overarching category and orange for the specific items within that category.
* **Layout:** The arrangement is symmetrical and balanced, with the central node ("Multi-Source Data") aligned directly beneath the main title box.
* **Content Scope:** The challenges span technical, data-related, and socio-ethical domains, indicating a holistic view of the problem space.
### Interpretation
This diagram serves as a high-level taxonomy, breaking down the broad, abstract concept of "Challenges and Limitations" into five concrete, manageable areas of concern for AI development and deployment.
* **Relationship of Elements:** The five sub-nodes are presented as co-equal components of the main challenge. They are not shown as interdependent or sequential, but as distinct facets that must be addressed individually. The arrows signify that each is a direct sub-category of the parent topic.
* **Implied Context:** The specific mention of "LLMs" (Large Language Models) in the final node strongly suggests the diagram's context is focused on the challenges inherent in modern generative AI systems. The other nodes support this: "Data Sensitivity" and "Multi-Source Data" relate to training data issues; "Complexity of AI Model" addresses technical opacity; and "Variability of Societal Norms" highlights the difficulty of aligning AI behavior with diverse human values.
* **Notable Absence:** The diagram is purely categorical and does not provide data, metrics, or prioritization (e.g., which challenge is most severe). It functions as a conceptual map or agenda-setter for discussion rather than an analytical chart.
* **Underlying Message:** The structure implies that overcoming the limitations of advanced AI is not a single problem but a multi-front effort requiring solutions across data governance, model architecture, ethical alignment, and technical interpretability.