## Line Chart: Separation between true and false statements across layers
### Overview
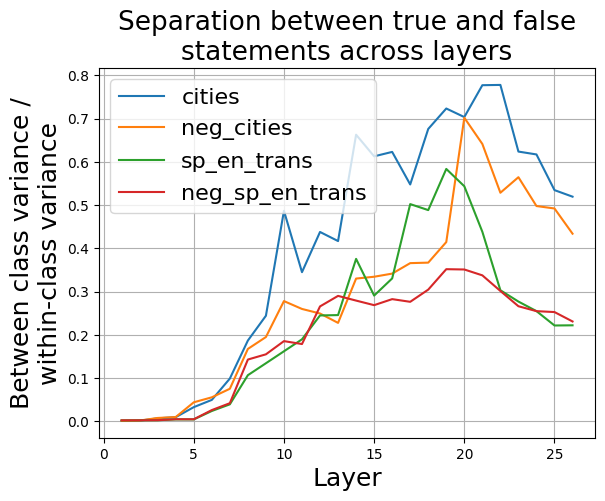
The image is a line chart comparing the separation between true and false statements across different layers for four categories: "cities", "neg_cities", "sp_en_trans", and "neg_sp_en_trans". The y-axis represents the ratio of between-class variance to within-class variance, while the x-axis represents the layer number. The chart shows how well the model can distinguish between true and false statements at each layer for each category.
### Components/Axes
* **Title:** Separation between true and false statements across layers
* **X-axis:**
* Label: Layer
* Scale: 0 to 25, with tick marks at intervals of 5.
* **Y-axis:**
* Label: Between class variance / within-class variance
* Scale: 0.0 to 0.8, with tick marks at intervals of 0.1.
* **Legend:** Located in the top-left corner of the chart.
* cities (Teal)
* neg\_cities (Orange)
* sp\_en\_trans (Green)
* neg\_sp\_en\_trans (Brown)
### Detailed Analysis
* **cities (Teal):** The line starts at approximately 0.0 at layer 0, increases sharply to approximately 0.48 at layer 11, fluctuates between 0.4 and 0.8 until layer 22, and then decreases to approximately 0.52 at layer 26.
* Layer 0: ~0.0
* Layer 11: ~0.48
* Layer 22: ~0.78
* Layer 26: ~0.52
* **neg\_cities (Orange):** The line starts at approximately 0.0 at layer 0, increases steadily to approximately 0.7 at layer 21, and then decreases to approximately 0.43 at layer 26.
* Layer 0: ~0.0
* Layer 21: ~0.7
* Layer 26: ~0.43
* **sp\_en\_trans (Green):** The line starts at approximately 0.0 at layer 0, increases to approximately 0.6 at layer 20, and then decreases to approximately 0.22 at layer 26.
* Layer 0: ~0.0
* Layer 20: ~0.6
* Layer 26: ~0.22
* **neg\_sp\_en\_trans (Brown):** The line starts at approximately 0.0 at layer 0, increases to approximately 0.35 at layer 21, and then decreases to approximately 0.22 at layer 26.
* Layer 0: ~0.0
* Layer 21: ~0.35
* Layer 26: ~0.22
### Key Observations
* The "cities" category shows the highest separation between true and false statements, reaching a peak of approximately 0.78 around layer 22.
* The "neg\_cities" category also shows a high separation, peaking at approximately 0.7 around layer 21.
* The "sp\_en\_trans" and "neg\_sp\_en\_trans" categories show lower separation values compared to "cities" and "neg\_cities".
* All categories show an increase in separation between true and false statements as the layer number increases, up to a certain point, after which the separation decreases.
### Interpretation
The chart suggests that the model is better at distinguishing between true and false statements for the "cities" and "neg\_cities" categories compared to the "sp\_en\_trans" and "neg\_sp\_en\_trans" categories. The peak separation values indicate the layers at which the model is most effective at distinguishing between true and false statements for each category. The decrease in separation after the peak suggests that the model may be overfitting or that the information needed to distinguish between true and false statements is no longer present in the later layers. The relationship between the categories suggests that the model may be learning different features for each category, leading to different levels of separation between true and false statements.