\n
## Line Chart: Separation between true and false statements across layers
### Overview
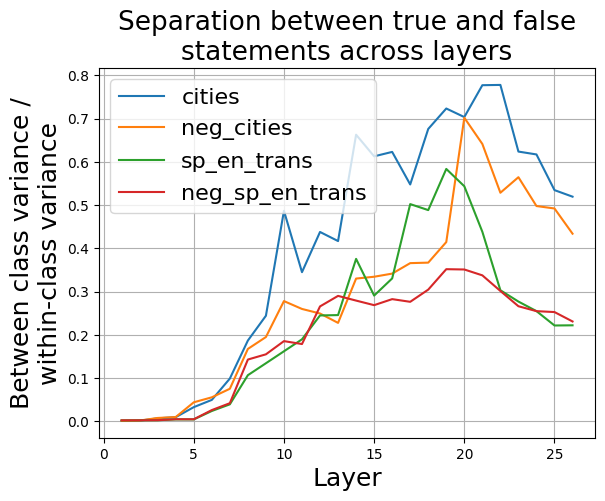
This line chart visualizes the separation between true and false statements across different layers, measured by the ratio of between-class variance to within-class variance. Four different data series are presented, representing different data processing approaches.
### Components/Axes
* **Title:** "Separation between true and false statements across layers" (positioned at the top-center)
* **X-axis:** "Layer" (ranging from approximately 0 to 27, with tick marks at integer values)
* **Y-axis:** "Between class variance / within-class variance" (ranging from approximately 0.0 to 0.8, with tick marks at 0.1 intervals)
* **Legend:** Located in the top-left corner, listing the four data series:
* "cities" (blue line)
* "neg\_cities" (orange line)
* "sp\_en\_trans" (green line)
* "neg\_sp\_en\_trans" (grey line)
### Detailed Analysis
The chart displays four lines representing the separation metric across layers.
* **cities (blue line):** This line starts at approximately 0.0 at layer 0 and generally slopes upward, with significant fluctuations. It reaches a peak of approximately 0.78 at layer 23, then declines to approximately 0.62 at layer 27.
* **neg\_cities (orange line):** This line also starts near 0.0 at layer 0 and increases with fluctuations. It reaches a peak of approximately 0.73 at layer 21, then declines to approximately 0.55 at layer 27.
* **sp\_en\_trans (green line):** This line begins at approximately 0.0 at layer 0 and exhibits a more gradual increase compared to the other lines. It reaches a maximum of approximately 0.61 at layer 21, then decreases to approximately 0.25 at layer 27.
* **neg\_sp\_en\_trans (grey line):** This line starts at approximately 0.0 at layer 0 and shows a slow, relatively stable increase. It reaches a maximum of approximately 0.35 at layer 11, then fluctuates and declines to approximately 0.22 at layer 27.
Here's a more detailed breakdown of approximate values at specific layers:
| Layer | cities | neg_cities | sp_en_trans | neg_sp_en_trans |
|---|---|---|---|---|
| 0 | 0.0 | 0.0 | 0.0 | 0.0 |
| 5 | 0.15 | 0.1 | 0.05 | 0.05 |
| 10 | 0.35 | 0.28 | 0.2 | 0.15 |
| 15 | 0.5 | 0.45 | 0.3 | 0.25 |
| 20 | 0.65 | 0.6 | 0.5 | 0.3 |
| 25 | 0.75 | 0.65 | 0.4 | 0.25 |
| 27 | 0.62 | 0.55 | 0.25 | 0.22 |
### Key Observations
* The "cities" and "neg\_cities" data series consistently exhibit higher separation values than "sp\_en\_trans" and "neg\_sp\_en\_trans".
* All lines show an initial increase in separation as the layer number increases, suggesting that deeper layers contribute to better separation.
* The "cities" line demonstrates the most significant fluctuations, indicating a potentially unstable or sensitive relationship between layers and separation.
* The "neg\_sp\_en\_trans" line consistently has the lowest separation values, suggesting it is the least effective approach for distinguishing between true and false statements.
### Interpretation
The chart suggests that the "cities" and "neg\_cities" approaches are more effective at separating true and false statements across layers than the "sp\_en\_trans" and "neg\_sp\_en\_trans" approaches. The initial increase in separation across layers indicates that deeper layers of the model contribute to improved discrimination between true and false statements. However, the fluctuations observed in the "cities" line suggest that this approach may be sensitive to specific layer configurations or data characteristics. The consistently low separation values for "neg\_sp\_en\_trans" suggest that this approach may not be suitable for this task.
The use of "neg" prefixes likely indicates a negation or inverse operation applied to the respective data series. The "sp\_en\_trans" likely refers to a Spanish-English translation process. The chart demonstrates how different data processing techniques impact the ability to distinguish between true and false statements within a layered model. The optimal layer number for maximum separation appears to be around layer 21-23 for the "cities" and "neg\_cities" approaches, after which separation begins to decline.