## Bar Chart: Relative Improvement (RI) by Hops
### Overview
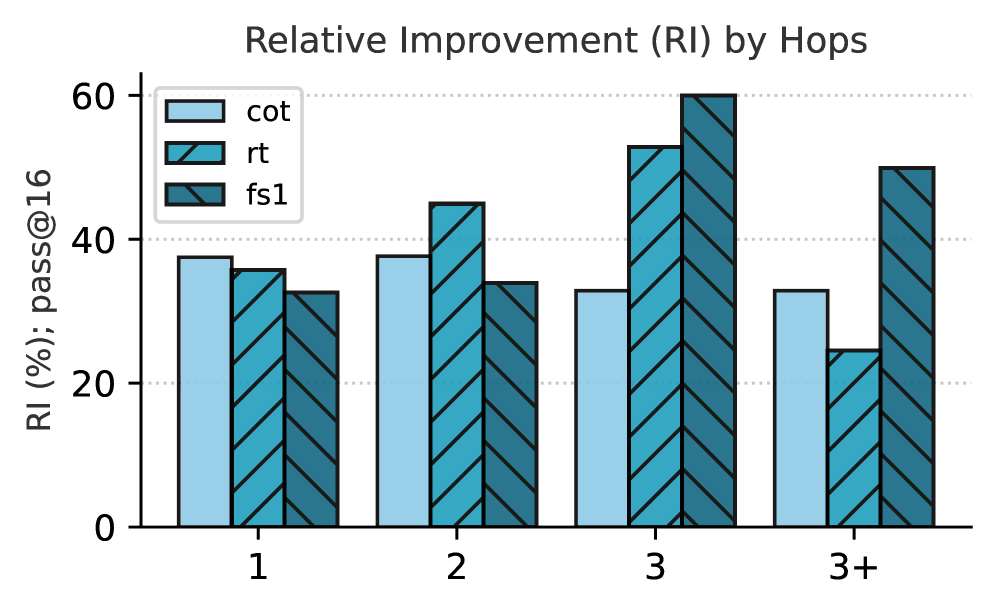
The image is a bar chart comparing the relative improvement (RI) of three different methods (cot, rt, fs1) across varying numbers of hops (1, 2, 3, 3+). The y-axis represents the RI in percentage, specifically "RI (%); pass@16", and the x-axis represents the number of hops.
### Components/Axes
* **Title:** Relative Improvement (RI) by Hops
* **X-axis:** Hops (categorical): 1, 2, 3, 3+
* **Y-axis:** RI (%); pass@16 (numerical): Scale from 0 to 60, with gridlines at intervals of 20.
* **Legend:** Located in the top-right corner.
* cot (light blue)
* rt (teal, with diagonal stripes)
* fs1 (dark teal, with diagonal stripes)
### Detailed Analysis
Here's a breakdown of the data for each hop count and method:
* **Hop 1:**
* cot: Approximately 38%
* rt: Approximately 36%
* fs1: Approximately 33%
* **Hop 2:**
* cot: Approximately 38%
* rt: Approximately 45%
* fs1: Approximately 35%
* **Hop 3:**
* cot: Approximately 34%
* rt: Approximately 54%
* fs1: Approximately 60%
* **Hop 3+:**
* cot: Approximately 34%
* rt: Approximately 24%
* fs1: Approximately 52%
### Key Observations
* The 'fs1' method shows the most significant improvement as the number of hops increases from 1 to 3.
* The 'rt' method also shows improvement from hop 1 to hop 3, but decreases at hop 3+.
* The 'cot' method remains relatively stable across all hop counts, with a slight decrease at hop 3 and 3+.
* For hop count 3, 'fs1' has the highest relative improvement, reaching approximately 60%.
### Interpretation
The chart suggests that the 'fs1' method benefits the most from an increased number of hops, indicating it might be more effective in scenarios requiring multiple steps or iterations. The 'rt' method shows a similar trend up to 3 hops, but its performance drops off when considering 3+ hops. The 'cot' method appears to be less sensitive to the number of hops, maintaining a consistent level of relative improvement. The "pass@16" likely refers to a metric or threshold used to evaluate the performance of these methods, indicating the percentage of times the method passes this threshold. The data implies that 'fs1' is the most effective method when multiple hops are involved, while 'cot' provides a more consistent performance regardless of the number of hops. The drop in 'rt' performance at 3+ hops could indicate a limitation or instability in that method when applied over a larger number of steps.