\n
## Bar Chart: Relative Improvement (RI) by Hops
### Overview
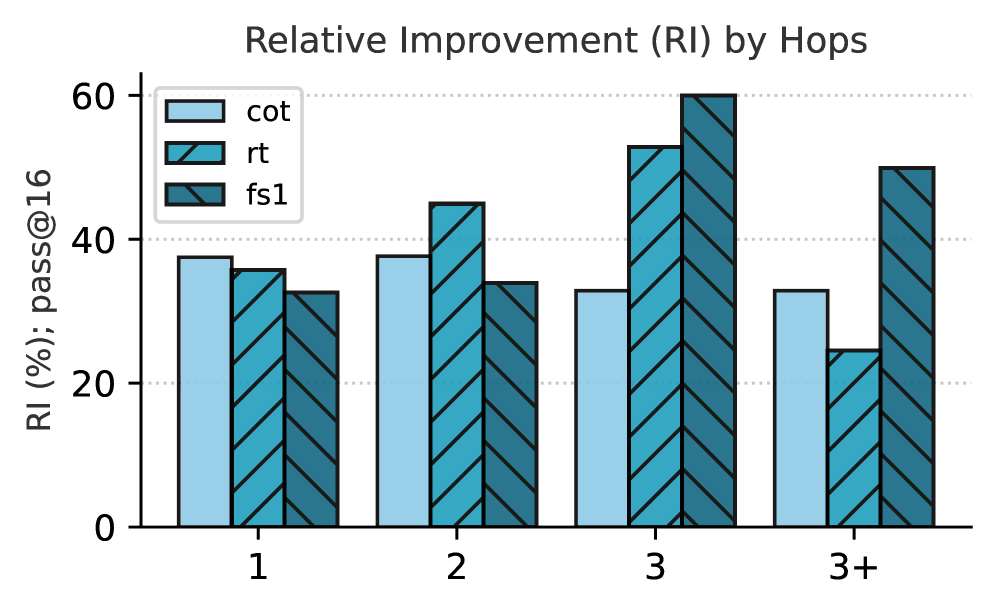
This bar chart displays the relative improvement (RI) in percentage (%) for three different models – 'cot', 'rt', and 'fs1' – across varying numbers of hops (1, 2, 3, and 3+). The y-axis represents the RI (%) and pass@16 metric, while the x-axis indicates the number of hops. Each hop count has three bars representing the RI for each model.
### Components/Axes
* **Title:** "Relative Improvement (RI) by Hops" - positioned at the top-center.
* **X-axis Label:** "Hops" - indicating the number of hops. Markers are at 1, 2, 3, and 3+.
* **Y-axis Label:** "RI (%) ; pass@16" - indicating the relative improvement in percentage and the pass@16 metric. The scale ranges from 0 to 60, with increments of 10.
* **Legend:** Located at the top-left corner.
* 'cot' - Light blue color.
* 'rt' - Gray color.
* 'fs1' - Teal color.
### Detailed Analysis
The chart consists of grouped bar plots for each hop count.
* **Hops = 1:**
* 'cot': Approximately 38%
* 'rt': Approximately 34%
* 'fs1': Approximately 31%
* **Hops = 2:**
* 'cot': Approximately 36%
* 'rt': Approximately 43%
* 'fs1': Approximately 32%
* **Hops = 3:**
* 'cot': Approximately 31%
* 'rt': Approximately 52%
* 'fs1': Approximately 59%
* **Hops = 3+:**
* 'cot': Approximately 26%
* 'rt': Approximately 45%
* 'fs1': Approximately 48%
**Trends:**
* **'cot'**: The RI for 'cot' generally decreases as the number of hops increases, starting at approximately 38% for 1 hop and decreasing to approximately 26% for 3+ hops.
* **'rt'**: The RI for 'rt' generally increases with the number of hops, starting at approximately 34% for 1 hop and reaching approximately 45% for 3+ hops.
* **'fs1'**: The RI for 'fs1' increases significantly from 1 to 3 hops (approximately 31% to 59%), then slightly decreases to approximately 48% for 3+ hops.
### Key Observations
* 'fs1' consistently demonstrates the highest relative improvement at 3 hops, significantly outperforming 'cot' and 'rt'.
* 'cot' shows the lowest relative improvement across all hop counts.
* The relative improvement for 'rt' increases steadily with the number of hops.
* The largest jump in relative improvement for 'fs1' occurs between 2 and 3 hops.
### Interpretation
The data suggests that increasing the number of hops generally improves the performance of 'rt' and 'fs1' models, while it negatively impacts the 'cot' model. 'fs1' appears to benefit the most from increasing hops, achieving the highest relative improvement at 3 hops. This could indicate that 'fs1' is better suited for more complex reasoning tasks that require multiple steps (hops). The 'cot' model's decreasing performance with more hops suggests it may be less effective at handling complex reasoning or may suffer from error propagation as the number of steps increases. The pass@16 metric, combined with RI, suggests that the models are being evaluated on their ability to achieve a certain level of accuracy (pass@16) and the relative improvement indicates how much better they are performing compared to a baseline. The 3+ hops category may represent a more diverse set of scenarios, leading to a slight decrease in 'fs1' performance compared to the peak at 3 hops.