## Bar Chart: Relative Improvement (RI) by Hops
### Overview
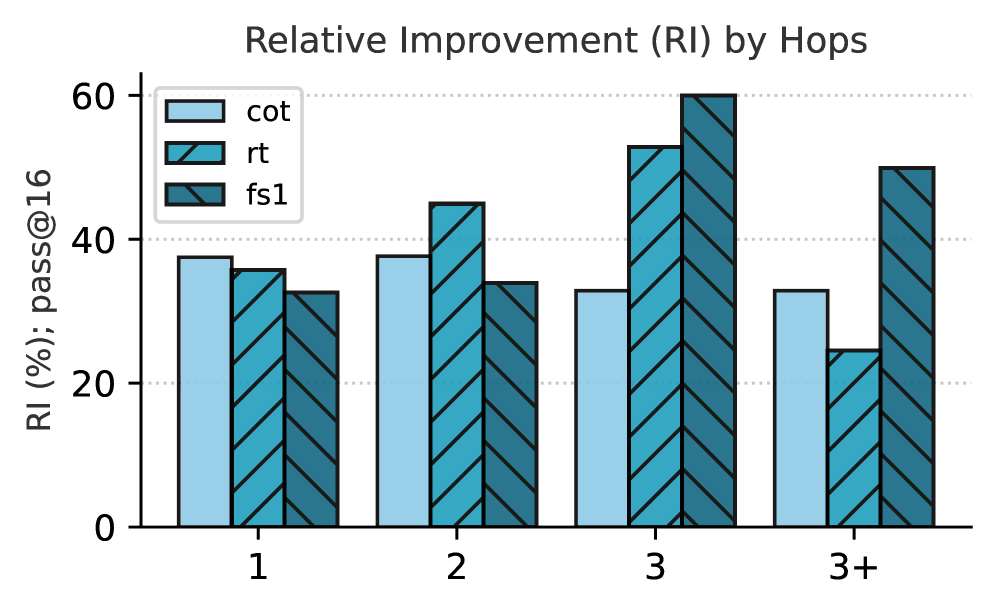
The chart visualizes the Relative Improvement (RI) percentage across four hop categories (1, 2, 3, 3+) for three metrics: `cot`, `rt`, and `fs1`. RI is measured against a baseline (`pass@16`), with values ranging from 0% to 60%. Each metric is represented by a distinct color-coded bar group per hop category.
### Components/Axes
- **X-axis**: Hop categories labeled as "1", "2", "3", and "3+".
- **Y-axis**: RI (%) with a secondary label "pass@16" in parentheses, scaled from 0 to 60.
- **Legend**: Located on the right, mapping:
- `cot` → light blue (solid)
- `rt` → medium blue (diagonal stripes)
- `fs1` → dark blue (diagonal stripes)
- **Bar Groups**: Each hop category contains three adjacent bars (one per metric), ordered left-to-right as `cot`, `rt`, `fs1`.
### Detailed Analysis
#### Hop Category 1
- `cot`: ~38% (light blue)
- `rt`: ~36% (medium blue)
- `fs1`: ~32% (dark blue)
#### Hop Category 2
- `cot`: ~39% (light blue)
- `rt`: ~45% (medium blue)
- `fs1`: ~34% (dark blue)
#### Hop Category 3
- `cot`: ~33% (light blue)
- `rt`: ~52% (medium blue)
- `fs1`: ~60% (dark blue)
#### Hop Category 3+
- `cot`: ~33% (light blue)
- `rt`: ~24% (medium blue)
- `fs1`: ~50% (dark blue)
### Key Observations
1. **`fs1` Dominance in High Hops**: `fs1` achieves the highest RI in categories 3 (60%) and 3+ (50%), suggesting superior performance in complex scenarios.
2. **`rt` Volatility**: `rt` peaks at 52% in category 3 but drops sharply to 24% in 3+, indicating potential instability in extreme cases.
3. **`cot` Stability**: `cot` remains relatively flat (~33–39%) across all categories, acting as a consistent baseline.
4. **Divergence in 3+**: The largest gap between metrics occurs in 3+, where `fs1` (50%) outperforms `rt` (24%) by 26 percentage points.
### Interpretation
The data implies that `fs1` is the most effective metric for improving RI in high-hop scenarios (3+), while `rt` underperforms in extreme cases. `cot` serves as a stable reference point, possibly representing a control or foundational measurement. The sharp decline in `rt` for 3+ suggests it may not scale well with increased complexity, whereas `fs1` maintains robustness. This could inform prioritization of `fs1` in systems requiring high-hop efficiency.