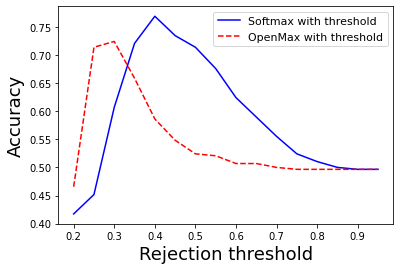
## Line Graph: Accuracy vs. Rejection Threshold for Softmax and OpenMax with Threshold
### Overview
The image is a line graph comparing the accuracy of two classification methods—**Softmax with threshold** and **OpenMax with threshold**—as a function of the **rejection threshold**. The x-axis represents the rejection threshold (ranging from 0.2 to 0.9), and the y-axis represents accuracy (ranging from 0.4 to 0.75). Two lines are plotted: a solid blue line for Softmax and a dashed red line for OpenMax. The legend is positioned in the top-right corner.
---
### Components/Axes
- **X-axis (Horizontal)**:
- Label: "Rejection threshold"
- Scale: 0.2 to 0.9 in increments of 0.1
- **Y-axis (Vertical)**:
- Label: "Accuracy"
- Scale: 0.4 to 0.75 in increments of 0.05
- **Legend**:
- Position: Top-right corner
- Entries:
- Solid blue: "Softmax with threshold"
- Dashed red: "OpenMax with threshold"
---
### Detailed Analysis
#### Softmax with threshold (Solid Blue Line)
- **Trend**:
- Starts at ~0.42 accuracy at a rejection threshold of 0.2.
- Rises sharply to a peak of ~0.75 accuracy at a rejection threshold of ~0.4.
- Declines gradually to ~0.5 accuracy at a rejection threshold of 0.9.
- **Key Data Points**:
- (0.2, 0.42)
- (0.4, 0.75)
- (0.9, 0.50)
#### OpenMax with threshold (Dashed Red Line)
- **Trend**:
- Starts at ~0.72 accuracy at a rejection threshold of 0.2.
- Declines steadily to ~0.5 accuracy at a rejection threshold of 0.9.
- No clear peak; maintains a downward slope throughout.
- **Key Data Points**:
- (0.2, 0.72)
- (0.9, 0.50)
---
### Key Observations
1. **Performance Divergence**:
- Softmax achieves higher peak accuracy (~0.75) compared to OpenMax (~0.72) but only at a rejection threshold of ~0.4.
- OpenMax maintains higher accuracy at lower rejection thresholds (e.g., 0.2–0.3) but degrades faster.
2. **Convergence at High Thresholds**:
- Both methods converge to ~0.5 accuracy at a rejection threshold of 0.9, suggesting similar performance under strict rejection criteria.
3. **Trade-off**:
- Softmax sacrifices initial accuracy for higher peak performance, while OpenMax prioritizes early accuracy but declines more steeply.
---
### Interpretation
The graph highlights a trade-off between **rejection threshold** and **accuracy** for the two methods:
- **Softmax with threshold** is optimal for scenarios requiring high accuracy at moderate rejection thresholds (e.g., ~0.4), but its performance degrades significantly at higher thresholds.
- **OpenMax with threshold** performs better at low rejection thresholds (e.g., 0.2–0.3) but becomes less reliable as thresholds increase.
The convergence at high thresholds implies that both methods struggle equally when rejecting a large proportion of inputs. This could reflect limitations in model confidence calibration or dataset complexity. Practitioners must balance the need for accuracy against the cost of rejecting inputs, depending on application requirements (e.g., medical diagnostics vs. casual classification tasks).
No anomalies or outliers are observed; trends align with expected behavior for threshold-based classification systems.