## Chart Type: Line Chart
### Overview
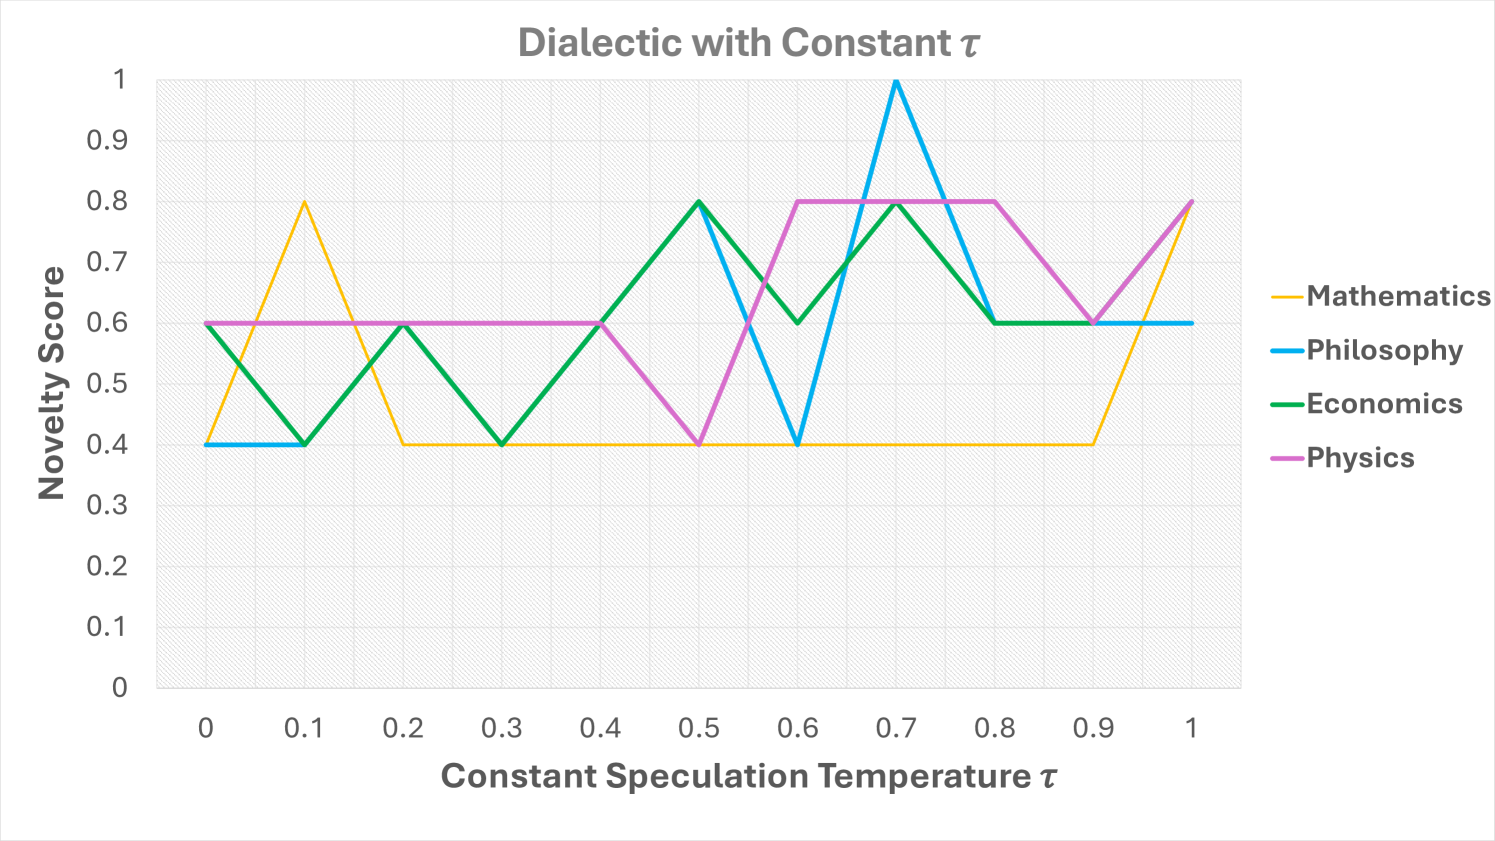
The image is a line chart titled "Dialectic with Constant τ". It displays the "Novelty Score" on the y-axis against the "Constant Speculation Temperature τ" on the x-axis for four different categories: Mathematics, Philosophy, Economics, and Physics. The chart shows how the novelty score changes with respect to the constant speculation temperature for each category.
### Components/Axes
* **Title:** Dialectic with Constant τ
* **X-axis:**
* Label: Constant Speculation Temperature τ
* Scale: 0 to 1, with increments of 0.1
* **Y-axis:**
* Label: Novelty Score
* Scale: 0 to 1, with increments of 0.1
* **Legend:** Located on the right side of the chart.
* Mathematics (Yellow)
* Philosophy (Blue)
* Economics (Green)
* Physics (Pink/Magenta)
### Detailed Analysis
* **Mathematics (Yellow):**
* Trend: Starts at approximately 0.6, rises to 0.8 at x=0.1, then decreases to 0.4 at x=0.3, remains constant at 0.4 until x=0.9, and then rises to 0.8 at x=1.
* Data Points: (0, 0.6), (0.1, 0.8), (0.3, 0.4), (0.4, 0.4), (0.5, 0.4), (0.6, 0.4), (0.7, 0.4), (0.8, 0.4), (0.9, 0.4), (1, 0.8)
* **Philosophy (Blue):**
* Trend: Starts at 0.4, remains constant until x=0.6, rises sharply to 1 at x=0.7, then drops to 0.6 at x=0.8, and remains constant at 0.6 until x=1.
* Data Points: (0, 0.4), (0.1, 0.4), (0.2, 0.4), (0.3, 0.4), (0.4, 0.4), (0.5, 0.4), (0.6, 0.4), (0.7, 1), (0.8, 0.6), (0.9, 0.6), (1, 0.6)
* **Economics (Green):**
* Trend: Starts at 0.6, decreases to 0.4 at x=0.1, increases to 0.8 at x=0.5, decreases to 0.6 at x=0.6, increases to 0.8 at x=0.7, decreases to 0.6 at x=0.8, and remains constant at 0.6 until x=1.
* Data Points: (0, 0.6), (0.1, 0.4), (0.2, 0.6), (0.3, 0.4), (0.4, 0.6), (0.5, 0.8), (0.6, 0.6), (0.7, 0.8), (0.8, 0.6), (0.9, 0.6), (1, 0.6)
* **Physics (Pink/Magenta):**
* Trend: Starts at 0.6, remains constant until x=0.4, decreases to 0.4 at x=0.5, increases to 0.8 at x=0.7, decreases to 0.6 at x=0.9, and then increases to 0.8 at x=1.
* Data Points: (0, 0.6), (0.1, 0.6), (0.2, 0.6), (0.3, 0.6), (0.4, 0.6), (0.5, 0.4), (0.6, 0.6), (0.7, 0.8), (0.8, 0.8), (0.9, 0.6), (1, 0.8)
### Key Observations
* Philosophy has the highest novelty score, reaching 1 at a constant speculation temperature of 0.7.
* Mathematics has the lowest novelty score, remaining at 0.4 for a large range of constant speculation temperatures.
* Economics and Physics have similar trends, with fluctuations in their novelty scores.
### Interpretation
The chart illustrates how the novelty score of different fields (Mathematics, Philosophy, Economics, and Physics) changes with respect to the constant speculation temperature. Philosophy shows a significant spike in novelty at a specific temperature, suggesting that speculation might be particularly fruitful in this field under certain conditions. Mathematics, on the other hand, remains relatively stable and low, indicating that its novelty might be less dependent on speculation temperature within the range considered. Economics and Physics show more dynamic behavior, suggesting a more complex relationship between speculation and novelty in these fields. The data suggests that the impact of speculation on novelty varies significantly across different disciplines.