## Line Chart: Dialectic with Constant τ
### Overview
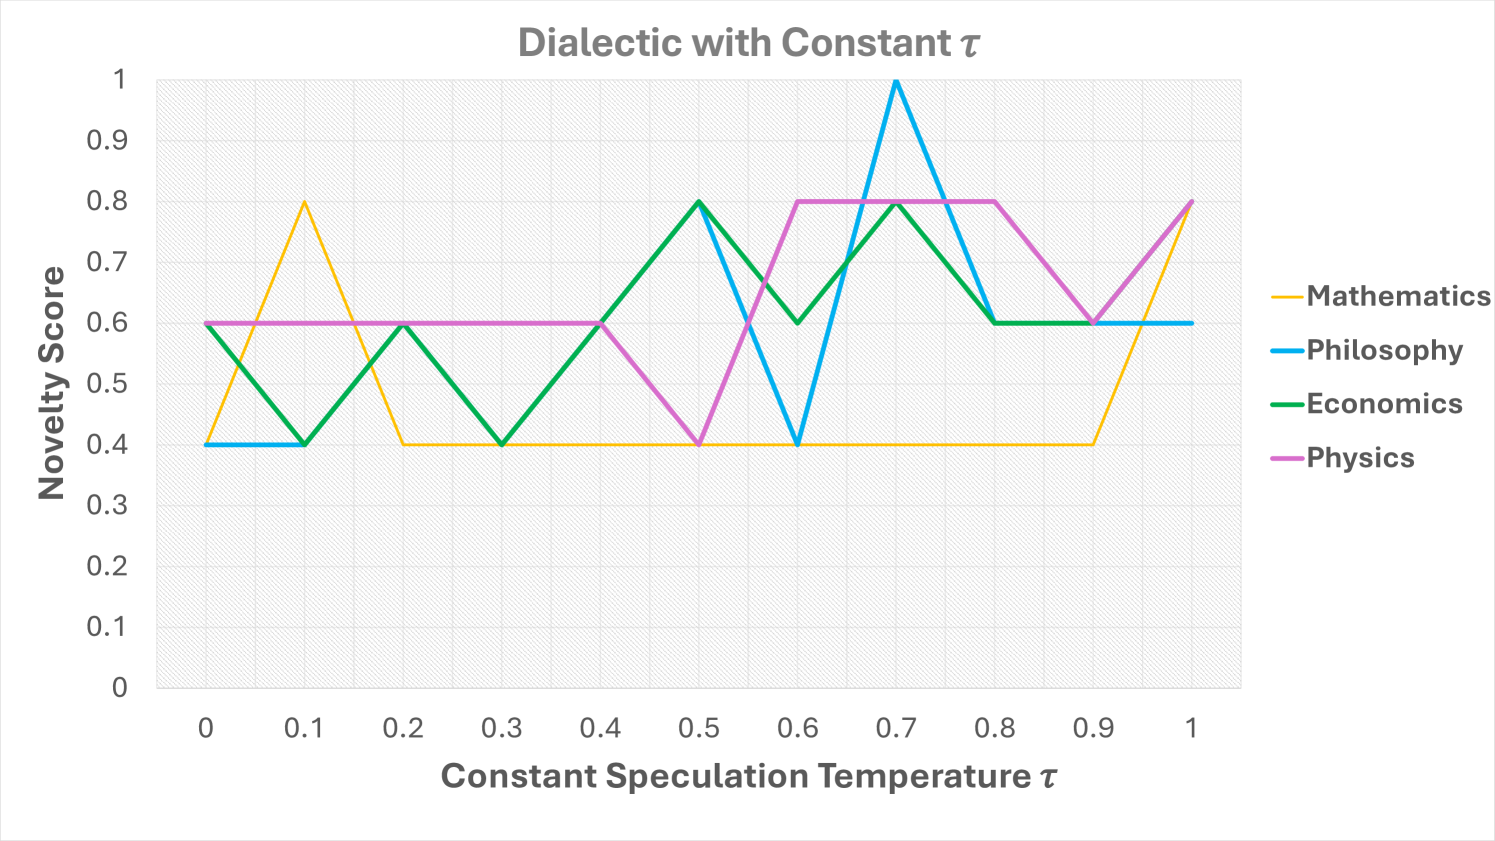
The image presents a line chart illustrating the relationship between "Constant Speculation Temperature τ" (x-axis) and "Novelty Score" (y-axis) for four different disciplines: Mathematics, Philosophy, Economics, and Physics. The chart appears to explore how novelty changes with a constant level of speculative thinking within each field.
### Components/Axes
* **Title:** "Dialectic with Constant τ" - positioned at the top-center of the chart.
* **X-axis:** "Constant Speculation Temperature τ" - ranging from 0 to 1, with tick marks at 0, 0.1, 0.2, 0.3, 0.4, 0.5, 0.6, 0.7, 0.8, 0.9, and 1.
* **Y-axis:** "Novelty Score" - ranging from 0 to 1, with tick marks at 0, 0.1, 0.2, 0.3, 0.4, 0.5, 0.6, 0.7, 0.8, 0.9, and 1.
* **Legend:** Located in the top-right corner of the chart. It maps colors to disciplines:
* Yellow: Mathematics
* Blue: Philosophy
* Green: Economics
* Purple: Physics
### Detailed Analysis
The chart displays four distinct lines, each representing a discipline.
* **Mathematics (Yellow):** The line starts at approximately 0.75 at τ = 0, decreases to around 0.4 at τ = 0.2, remains relatively stable around 0.4-0.5 until τ = 0.9, and then increases to approximately 0.72 at τ = 1. The trend is initially decreasing, then relatively flat, and finally increasing.
* **Philosophy (Blue):** The line begins at approximately 0.42 at τ = 0, increases to a peak of around 0.95 at τ = 0.7, and then decreases to approximately 0.65 at τ = 1. This line exhibits a strong upward trend followed by a decline.
* **Economics (Green):** The line starts at approximately 0.55 at τ = 0, decreases to around 0.4 at τ = 0.2, increases to approximately 0.75 at τ = 0.6, and then decreases to around 0.6 at τ = 1. The trend is initially decreasing, then increasing, and finally decreasing.
* **Physics (Purple):** The line begins at approximately 0.56 at τ = 0, remains relatively stable around 0.55-0.6 until τ = 0.4, increases to approximately 0.78 at τ = 0.7, and then decreases to around 0.75 at τ = 1. The trend is relatively flat, then increasing, and finally slightly decreasing.
### Key Observations
* Philosophy exhibits the highest novelty score, peaking at approximately 0.95.
* Mathematics consistently has the lowest novelty score, remaining below 0.8 throughout the entire range of τ.
* Economics and Physics show similar trends, with initial decreases followed by increases and then decreases.
* The lines intersect multiple times, indicating that the relationship between τ and novelty score varies across disciplines.
* There is a general trend of increasing novelty scores with increasing τ for Philosophy and Physics, while Mathematics shows a more complex pattern.
### Interpretation
The chart suggests that the relationship between speculative thinking (τ) and novelty is discipline-specific. Philosophy appears to benefit most from increased speculation, reaching a peak novelty score at τ = 0.7. Mathematics, on the other hand, seems less sensitive to speculation, maintaining a relatively low novelty score across all values of τ. Economics and Physics exhibit intermediate behavior, suggesting that speculation can initially hinder novelty but eventually lead to breakthroughs.
The varying responses of each discipline could be attributed to their inherent methodologies and the nature of their respective fields. Philosophy, being more abstract and open-ended, might thrive on speculative exploration. Mathematics, with its emphasis on rigorous proof and logical deduction, might require a more cautious approach to speculation.
The chart highlights the importance of considering the context of a discipline when evaluating the role of speculation in fostering novelty. It also suggests that there is an optimal level of speculation for each field, beyond which novelty may decline. The intersection points of the lines indicate moments where different disciplines achieve similar levels of novelty at the same speculation temperature, potentially revealing areas of interdisciplinary synergy.