\n
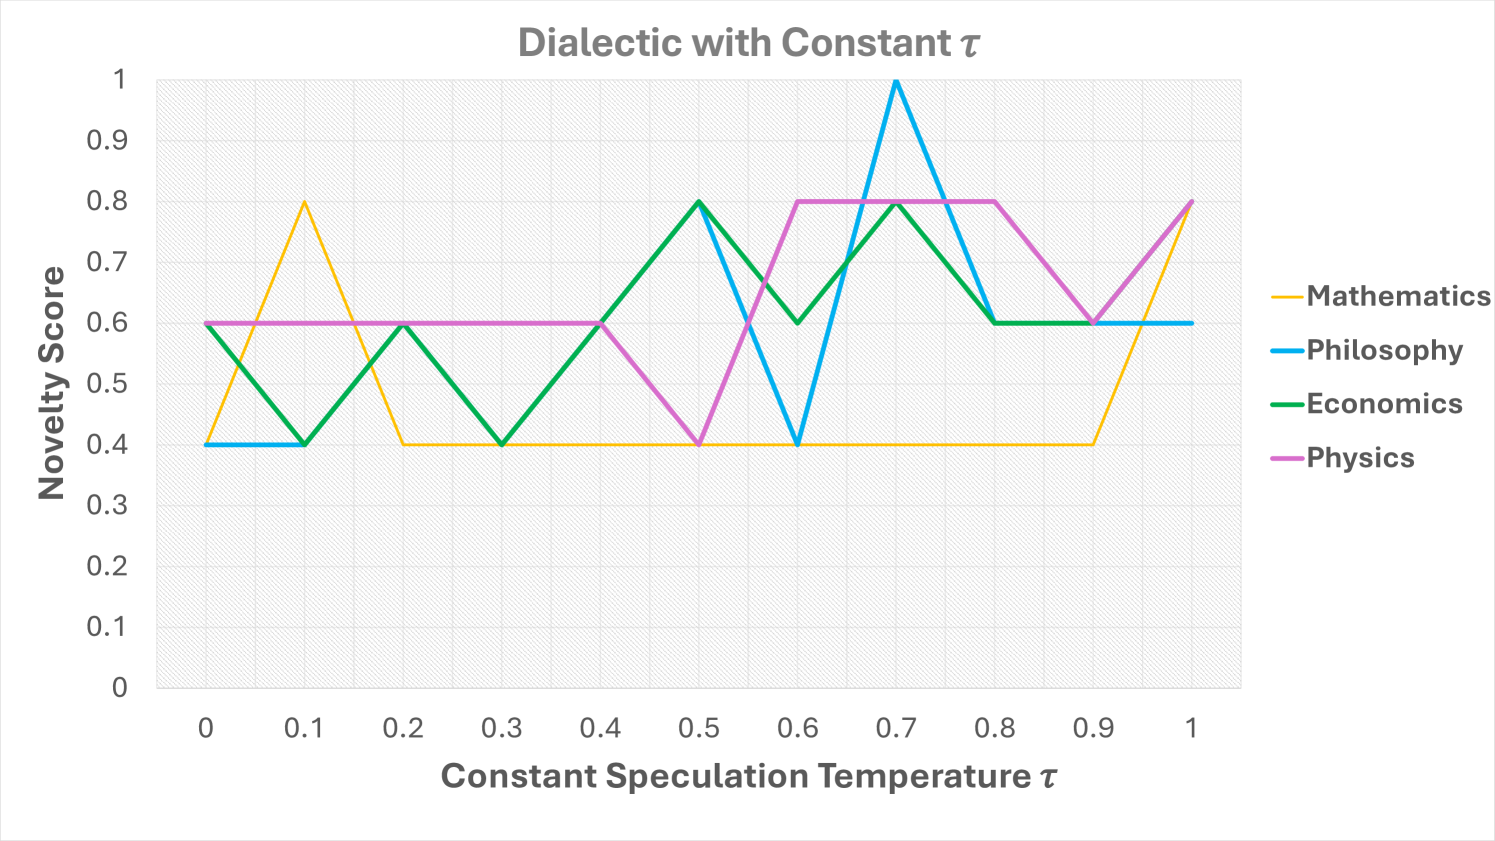
## Line Chart: Dialectic with Constant τ
### Overview
The image is a line chart titled "Dialectic with Constant τ". It plots the "Novelty Score" (y-axis) against the "Constant Speculation Temperature τ" (x-axis) for four academic disciplines: Mathematics, Philosophy, Economics, and Physics. The chart displays how the novelty score for each discipline varies as the speculation temperature parameter τ increases from 0 to 1.
### Components/Axes
* **Title:** "Dialectic with Constant τ" (centered at the top).
* **Y-Axis:** Labeled "Novelty Score". The scale runs from 0 to 1, with major gridlines and numerical markers at every 0.1 increment (0, 0.1, 0.2, ..., 1).
* **X-Axis:** Labeled "Constant Speculation Temperature τ". The scale runs from 0 to 1, with major gridlines and numerical markers at every 0.1 increment (0, 0.1, 0.2, ..., 1).
* **Legend:** Positioned on the right side of the chart. It contains four entries, each with a colored line segment and a label:
* Yellow line: **Mathematics**
* Blue line: **Philosophy**
* Green line: **Economics**
* Purple line: **Physics**
### Detailed Analysis
The chart contains four distinct data series. The approximate data points for each series, read from the grid, are as follows:
**1. Mathematics (Yellow Line)**
* **Trend:** Starts low, spikes sharply early, then remains flat at a low level before rising again at the end.
* **Data Points (τ, Novelty Score):**
* (0, 0.4)
* (0.1, 0.8) - **Peak**
* (0.2, 0.4)
* (0.3, 0.4)
* (0.4, 0.4)
* (0.5, 0.4)
* (0.6, 0.4)
* (0.7, 0.4)
* (0.8, 0.4)
* (0.9, 0.4)
* (1.0, 0.8)
**2. Philosophy (Blue Line)**
* **Trend:** Remains flat at a low level for the first half, then exhibits a very sharp, singular peak in the second half before settling at a moderate level.
* **Data Points (τ, Novelty Score):**
* (0, 0.4)
* (0.1, 0.4)
* (0.2, 0.4)
* (0.3, 0.4)
* (0.4, 0.4)
* (0.5, 0.4)
* (0.6, 0.4)
* (0.7, 1.0) - **Global Maximum for the entire chart**
* (0.8, 0.6)
* (0.9, 0.6)
* (1.0, 0.6)
**3. Economics (Green Line)**
* **Trend:** Shows significant fluctuation throughout the range, with multiple peaks and troughs.
* **Data Points (τ, Novelty Score):**
* (0, 0.6)
* (0.1, 0.4)
* (0.2, 0.6)
* (0.3, 0.4)
* (0.4, 0.6)
* (0.5, 0.8) - **Peak (tied)**
* (0.6, 0.6)
* (0.7, 0.8) - **Peak (tied)**
* (0.8, 0.6)
* (0.9, 0.6)
* (1.0, 0.6)
**4. Physics (Purple Line)**
* **Trend:** Maintains a steady, moderate score for the first half, dips, then rises to a sustained high plateau before a final dip and recovery.
* **Data Points (τ, Novelty Score):**
* (0, 0.6)
* (0.1, 0.6)
* (0.2, 0.6)
* (0.3, 0.6)
* (0.4, 0.6)
* (0.5, 0.4)
* (0.6, 0.8)
* (0.7, 0.8)
* (0.8, 0.8) - **Plateau**
* (0.9, 0.6)
* (1.0, 0.8)
### Key Observations
1. **Peak Novelty:** The single highest novelty score (1.0) is achieved by Philosophy at τ = 0.7.
2. **Early vs. Late Peaks:** Mathematics peaks very early (τ=0.1), while Philosophy peaks later (τ=0.7). Economics has twin peaks in the middle-to-late range (τ=0.5 and 0.7).
3. **Stability:** Physics shows the most stable behavior, maintaining a score of 0.6 for the first half and 0.8 for a significant portion of the second half. Mathematics is also notably stable (flat at 0.4) for a long middle segment (τ=0.2 to 0.9).
4. **Convergence:** At the final data point (τ=1.0), three disciplines (Mathematics, Physics, Economics) converge at a high novelty score of 0.8, while Philosophy settles lower at 0.6.
5. **Volatility:** Economics is the most volatile series, changing direction frequently. Philosophy is the least volatile, with only one major change.
### Interpretation
This chart appears to model the relationship between a speculative parameter (τ) and the perceived "novelty" of outputs or ideas within different academic fields. The "dialectic" in the title suggests a process of thesis and antithesis, where τ might control the degree of speculative or creative deviation from established norms.
* **Field-Specific Sensitivity:** The data suggests each discipline has a unique "sweet spot" for generating novelty through speculation. Mathematics benefits from very low speculation, Philosophy from a specific high level, and Economics from a fluctuating, mid-to-high range. This could reflect differing methodologies: mathematics values logical rigor (low speculation), while philosophy might thrive on bold, singular leaps of thought.
* **The τ=0.7 Anomaly:** The value τ=0.7 is particularly interesting, yielding the global maximum for Philosophy and a tied peak for Economics, while Mathematics remains at its baseline. This indicates a parameter setting that is highly generative for some fields but not others.
* **Convergence at High Speculation:** The convergence of three fields at high novelty when τ=1 (maximum speculation) suggests that at the extreme end of speculative thinking, the outputs of mathematics, physics, and economics may become similarly novel or unconventional, potentially blurring disciplinary boundaries.
* **Model Limitations:** The use of discrete, seemingly integer-based scores (0.4, 0.6, 0.8) and the perfectly flat lines suggest this is likely a stylized or theoretical model rather than a plot of empirical data. It serves as a conceptual framework for discussing how speculative thinking impacts innovation across different domains of knowledge.