## Line Chart: Dialectic with Constant τ
### Overview
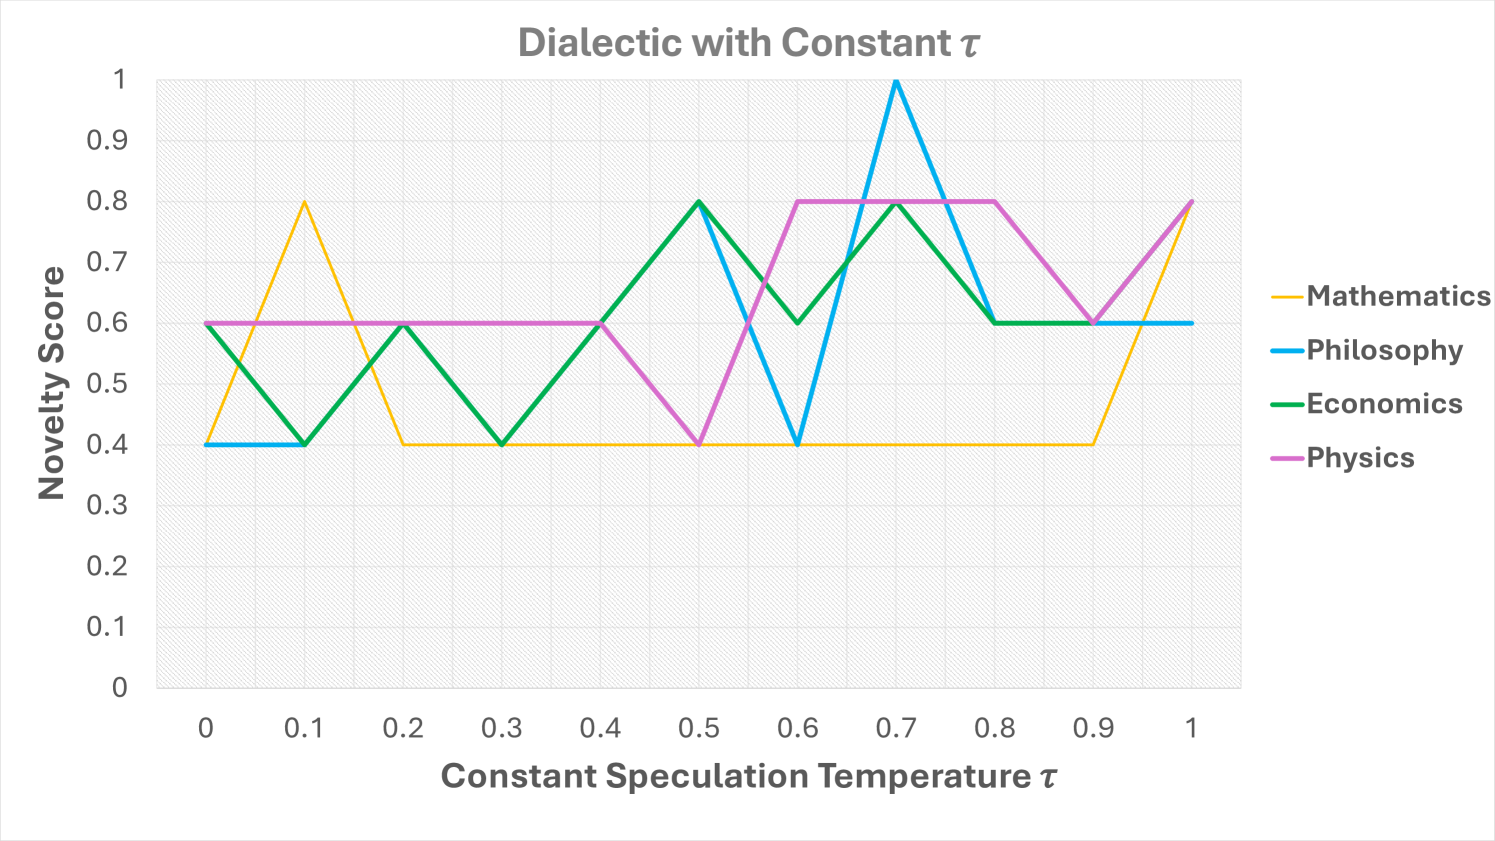
The chart visualizes the relationship between "Constant Speculation Temperature τ" (x-axis) and "Novelty Score" (y-axis) across four disciplines: Mathematics, Philosophy, Economics, and Physics. Each discipline is represented by a distinct colored line with unique patterns of peaks and troughs. The y-axis ranges from 0 to 1, while the x-axis spans τ values from 0 to 1 in increments of 0.1.
### Components/Axes
- **X-axis**: "Constant Speculation Temperature τ" (0 to 1, increments of 0.1).
- **Y-axis**: "Novelty Score" (0 to 1, increments of 0.1).
- **Legend**: Located on the right, mapping colors to disciplines:
- **Yellow**: Mathematics
- **Blue**: Philosophy
- **Green**: Economics
- **Purple**: Physics
### Detailed Analysis
#### Mathematics (Yellow)
- Starts at **0.4** (τ=0).
- Peaks at **0.8** (τ=0.1).
- Drops to **0.4** (τ=0.2) and remains flat until τ=1.0, where it peaks again at **0.8**.
#### Philosophy (Blue)
- Starts at **0.4** (τ=0).
- Peaks sharply at **1.0** (τ=0.7).
- Drops to **0.6** (τ=0.8) and remains flat until τ=1.0.
#### Economics (Green)
- Starts at **0.6** (τ=0).
- Peaks at **0.6** (τ=0.2), **0.8** (τ=0.5), **0.8** (τ=0.7), and **0.8** (τ=1.0).
- Dips to **0.4** (τ=0.3) and **0.6** (τ=0.6).
#### Physics (Purple)
- Starts at **0.6** (τ=0).
- Drops to **0.4** (τ=0.5).
- Rises to **0.8** (τ=0.6), remains flat until τ=0.9, then drops to **0.6** (τ=1.0).
### Key Observations
1. **Philosophy** exhibits the highest peak (**1.0** at τ=0.7), suggesting maximal novelty at this speculation temperature.
2. **Mathematics** and **Physics** show bimodal patterns, with peaks at τ=0.1 and τ=1.0 (Mathematics) and τ=0.6 and τ=1.0 (Physics).
3. **Economics** has the most frequent peaks, occurring at τ=0.2, 0.5, 0.7, and 1.0.
4. All disciplines share a baseline of **0.4–0.6** at τ=0, indicating minimal novelty at the lowest speculation temperature.
### Interpretation
The chart suggests that novelty scores vary non-linearly with speculation temperature across disciplines. Philosophy’s sharp peak at τ=0.7 implies a critical threshold for maximal innovation in this field. Mathematics and Physics show symmetry in their bimodal patterns, potentially reflecting cyclical or dual-phase innovation dynamics. Economics’ frequent peaks may indicate sensitivity to incremental changes in τ. The absence of data below **0.4** for all disciplines at τ=0 suggests a foundational stability or baseline constraint in speculative thinking. Outliers like Philosophy’s **1.0** peak highlight exceptional sensitivity to τ in this discipline.