## Line Chart: ΔP vs. Layer for Qwen Models
### Overview
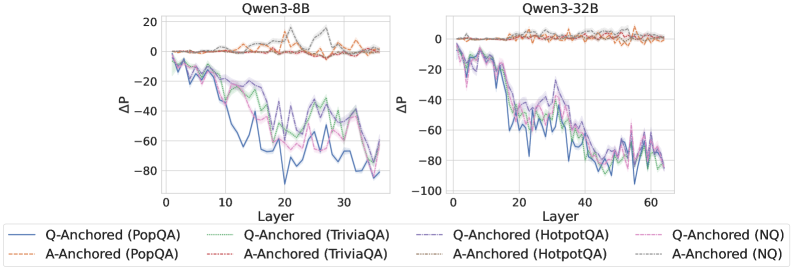
The image presents two line charts comparing the change in performance (ΔP) across different layers of two Qwen language models: Qwen3-8B and Qwen3-32B. The charts display performance differences for various question-answering datasets, distinguished by anchoring methods (Q-Anchored and A-Anchored).
### Components/Axes
* **X-axis:** Layer (ranging from 0 to approximately 30 for Qwen3-8B and 0 to 60 for Qwen3-32B).
* **Y-axis:** ΔP (ranging from approximately -100 to 20).
* **Models:** Qwen3-8B (left chart), Qwen3-32B (right chart).
* **Datasets/Anchoring:**
* PopQA (Q-Anchored and A-Anchored)
* TriviaQA (Q-Anchored and A-Anchored)
* HotpotQA (Q-Anchored and A-Anchored)
* NQ (Q-Anchored and A-Anchored)
* **Legend:** Located at the bottom of the image, associating colors with specific datasets and anchoring methods.
### Detailed Analysis or Content Details
**Qwen3-8B (Left Chart)**
* **Q-Anchored (PopQA):** (Blue line) Starts at approximately 0 ΔP at Layer 0, declines steadily to approximately -60 ΔP at Layer 20, then fluctuates between -60 and -80 ΔP until Layer 30.
* **A-Anchored (PopQA):** (Brown dashed line) Remains relatively stable around 0-10 ΔP until Layer 15, then declines to approximately -20 ΔP at Layer 30.
* **Q-Anchored (TriviaQA):** (Green line) Starts at approximately 0 ΔP, declines to approximately -40 ΔP at Layer 10, then fluctuates between -40 and -70 ΔP until Layer 30.
* **A-Anchored (TriviaQA):** (Purple dashed line) Starts at approximately 0 ΔP, declines to approximately -30 ΔP at Layer 10, then fluctuates between -30 and -60 ΔP until Layer 30.
* **Q-Anchored (HotpotQA):** (Orange line) Starts at approximately 0 ΔP, declines to approximately -20 ΔP at Layer 10, then fluctuates between -20 and -50 ΔP until Layer 30.
* **A-Anchored (HotpotQA):** (Red dashed line) Starts at approximately 0 ΔP, declines to approximately -10 ΔP at Layer 10, then fluctuates between -10 and -40 ΔP until Layer 30.
* **Q-Anchored (NQ):** (Light Blue line) Starts at approximately 0 ΔP, declines to approximately -20 ΔP at Layer 10, then fluctuates between -20 and -50 ΔP until Layer 30.
* **A-Anchored (NQ):** (Gray dashed line) Starts at approximately 0 ΔP, declines to approximately -10 ΔP at Layer 10, then fluctuates between -10 and -40 ΔP until Layer 30.
**Qwen3-32B (Right Chart)**
* **Q-Anchored (PopQA):** (Blue line) Starts at approximately 0 ΔP, declines to approximately -20 ΔP at Layer 10, then fluctuates between -20 and -60 ΔP until Layer 60.
* **A-Anchored (PopQA):** (Brown dashed line) Remains relatively stable around 0-10 ΔP until Layer 20, then declines to approximately -20 ΔP at Layer 60.
* **Q-Anchored (TriviaQA):** (Green line) Starts at approximately 0 ΔP, declines to approximately -20 ΔP at Layer 10, then fluctuates between -20 and -80 ΔP until Layer 60.
* **A-Anchored (TriviaQA):** (Purple dashed line) Starts at approximately 0 ΔP, declines to approximately -10 ΔP at Layer 10, then fluctuates between -10 and -60 ΔP until Layer 60.
* **Q-Anchored (HotpotQA):** (Orange line) Starts at approximately 0 ΔP, declines to approximately -20 ΔP at Layer 10, then fluctuates between -20 and -80 ΔP until Layer 60.
* **A-Anchored (HotpotQA):** (Red dashed line) Starts at approximately 0 ΔP, declines to approximately -10 ΔP at Layer 10, then fluctuates between -10 and -50 ΔP until Layer 60.
* **Q-Anchored (NQ):** (Light Blue line) Starts at approximately 0 ΔP, declines to approximately -20 ΔP at Layer 10, then fluctuates between -20 and -80 ΔP until Layer 60.
* **A-Anchored (NQ):** (Gray dashed line) Starts at approximately 0 ΔP, declines to approximately -10 ΔP at Layer 10, then fluctuates between -10 and -50 ΔP until Layer 60.
### Key Observations
* All datasets exhibit a negative trend in ΔP as the layer number increases, indicating a performance decrease with depth in both models.
* The Q-Anchored lines generally show a more significant decline in ΔP compared to the A-Anchored lines.
* The Qwen3-32B model shows a more pronounced decline in ΔP across all datasets compared to the Qwen3-8B model.
* The PopQA and NQ datasets consistently show the most significant declines in ΔP.
### Interpretation
The charts demonstrate that as the model depth (layer number) increases, performance on question-answering tasks tends to decrease. This suggests that deeper layers may not always contribute positively to performance and could potentially introduce noise or hinder the model's ability to generalize. The difference between Q-Anchored and A-Anchored lines suggests that the anchoring method impacts performance, with Q-Anchored generally performing worse. The larger decline in ΔP for Qwen3-32B compared to Qwen3-8B could indicate that the larger model is more susceptible to performance degradation with depth, or that the optimal depth for the larger model is different. The consistent performance decline on PopQA and NQ datasets suggests these datasets may be more sensitive to the effects of model depth. These findings could inform strategies for model pruning, layer selection, or architectural modifications to improve performance and efficiency.