## Line Graphs: ΔP vs Layer for Qwen3-8B and Qwen3-32B Models
### Overview
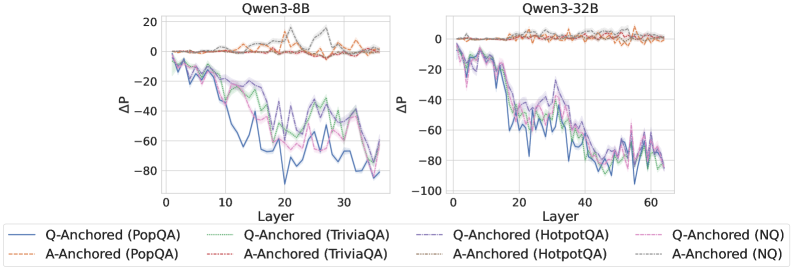
The image contains two line graphs comparing the performance metric ΔP (delta-P) across transformer model layers for two versions of the Qwen3 architecture: 8B (left) and 32B (right). Each graph shows four data series representing different anchoring strategies (Q-Anchored vs A-Anchored) across four datasets (PopQA, TriviaQA, HotpotQA, NQ). The graphs reveal layer-wise performance variations, with Q-Anchored models generally exhibiting more pronounced fluctuations than A-Anchored counterparts.
### Components/Axes
- **X-axis (Layer)**:
- Qwen3-8B: 0–30 (discrete increments)
- Qwen3-32B: 0–60 (discrete increments)
- **Y-axis (ΔP)**:
- Range: -100 to +20 (linear scale)
- Units: ΔP (delta-P, unspecified metric)
- **Legends**:
- **Q-Anchored**: Solid lines (blue, green, purple, pink)
- **A-Anchored**: Dashed lines (orange, brown, gray, black)
- **Datasets**:
- PopQA: Blue (solid) / Orange (dashed)
- TriviaQA: Green (solid) / Brown (dashed)
- HotpotQA: Purple (solid) / Gray (dashed)
- NQ: Pink (solid) / Black (dashed)
### Detailed Analysis
#### Qwen3-8B Graph
- **Q-Anchored (PopQA)**: Starts near 0, drops sharply to ~-80 at Layer 10, fluctuates between -60 and -20 until Layer 30.
- **A-Anchored (PopQA)**: Remains near 0 with minor oscillations (±5) throughout.
- **Q-Anchored (TriviaQA)**: Begins at 0, dips to ~-60 at Layer 15, stabilizes between -40 and -20.
- **A-Anchored (TriviaQA)**: Stays near 0 with slight dips to -5.
- **Q-Anchored (HotpotQA)**: Sharp drop to ~-70 at Layer 5, recovers to -30 by Layer 30.
- **A-Anchored (HotpotQA)**: Mild fluctuations between -5 and +5.
- **Q-Anchored (NQ)**: Oscillates between -50 and -10, peaking at -30 at Layer 20.
- **A-Anchored (NQ)**: Stable near 0 with minor ±3 variations.
#### Qwen3-32B Graph
- **Q-Anchored (PopQA)**: Starts at 0, plunges to ~-90 at Layer 10, recovers to -40 by Layer 60.
- **A-Anchored (PopQA)**: Remains near 0 with ±3 fluctuations.
- **Q-Anchored (TriviaQA)**: Drops to ~-70 at Layer 20, stabilizes between -50 and -30.
- **A-Anchored (TriviaQA)**: Stays near 0 with ±2 variations.
- **Q-Anchored (HotpotQA)**: Sharp decline to ~-85 at Layer 15, recovers to -50 by Layer 60.
- **A-Anchored (HotpotQA)**: Stable near 0 with ±1 fluctuations.
- **Q-Anchored (NQ)**: Oscillates between -80 and -20, peaking at -60 at Layer 40.
- **A-Anchored (NQ)**: Stays near 0 with ±2 variations.
### Key Observations
1. **Model Size Impact**: Qwen3-32B shows more extreme ΔP fluctuations than Qwen3-8B, particularly for Q-Anchored models.
2. **Anchoring Strategy**: A-Anchored models maintain near-zero ΔP across all layers and datasets, while Q-Anchored models exhibit significant layer-dependent variations.
3. **Dataset Sensitivity**:
- HotpotQA causes the most drastic ΔP drops in Q-Anchored models.
- NQ shows the largest amplitude fluctuations in Q-Anchored models.
4. **Layer Dynamics**:
- Early layers (0–10) show the most dramatic ΔP changes.
- Later layers (20–30/60) exhibit stabilization or partial recovery.
### Interpretation
The data suggests that anchoring strategy (Q vs A) critically influences model stability, with A-Anchored models demonstrating consistent performance across layers. Q-Anchored models, while potentially more expressive, suffer from layer-specific instability that worsens with model size. The dataset-specific patterns indicate varying sensitivity to anchoring methods, with complex reasoning tasks (HotpotQA, NQ) amplifying instability in Q-Anchored configurations. These findings highlight trade-offs between model expressiveness and stability in transformer architectures, with practical implications for model design and deployment.