## Grid Diagram: Symbol Placement and Numerical Annotations
### Overview
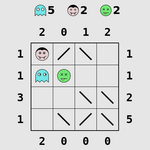
The image depicts a 4x4 grid with numerical labels on rows and columns, symbolic icons with associated counts, and diagonal slash marks in specific cells. The grid is annotated with positional numbers and includes a legend for symbolic interpretation.
### Components/Axes
- **Grid Structure**:
- **Rows**: Labeled `1`, `1`, `3`, `1` (top to bottom).
- **Columns**: Labeled `2`, `0`, `0`, `0` (left to right).
- **Top Row Symbols**:
- Ghost icon (blue) labeled `5`
- Face icon (black) labeled `2`
- Smiley face icon (green) labeled `2`
- **Bottom Row Numbers**: `2`, `0`, `0`, `0` (left to right).
- **Legend**:
- Ghost (blue) = `5`
- Face (black) = `2`
- Smiley face (green) = `2`
- **Slash Marks**: Diagonal lines (`\`) in specific cells (see Detailed Analysis).
### Detailed Analysis
1. **Grid Cell Contents**:
- **Row 1 (Top)**:
- Column 1: Face icon (black).
- Column 2: Diagonal slash (`\`).
- Column 3: Diagonal slash (`\`).
- Column 4: Empty.
- **Row 2**:
- Column 1: Ghost icon (blue).
- Column 2: Smiley face icon (green).
- Column 3: Empty.
- Column 4: Empty.
- **Row 3**:
- Column 1: Empty.
- Column 2: Empty.
- Column 3: Diagonal slash (`\`).
- Column 4: Diagonal slash (`\`).
- **Row 4 (Bottom)**:
- Column 1: Empty.
- Column 2: Empty.
- Column 3: Diagonal slash (`\`).
- Column 4: Diagonal slash (`\`).
2. **Numerical Annotations**:
- **Top Row Symbols**:
- Ghost (`5`), Face (`2`), Smiley (`2`) are positioned above the grid, aligned with columns 1–3.
- **Bottom Row Numbers**:
- Column 1: `2` (aligned with Row 4, Column 1).
- Columns 2–4: `0` (aligned with Row 4, Columns 2–4).
3. **Legend Cross-Reference**:
- Ghost icon (blue) matches the count `5` at the top.
- Face icon (black) matches the count `2` at the top.
- Smiley face (green) matches the count `2` at the top.
### Key Observations
- **Symbol Distribution**:
- Ghost and Face icons appear once each in the grid, despite their top-row counts (`5` and `2`, respectively). This discrepancy suggests the top-row numbers may represent categories or weights rather than direct counts.
- Smiley face icon appears once, matching its top-row count (`2`), but only one instance is present in the grid.
- **Slash Pattern**:
- Diagonal slashes (`\`) are concentrated in the lower-right quadrant (Rows 3–4, Columns 3–4), potentially indicating a trend or relationship between these cells.
- **Numerical Anomalies**:
- The bottom row’s `2` in Column 1 does not align with any visible symbol in that cell, suggesting it may represent a cumulative or residual value.
### Interpretation
- **Data Structure**: The grid likely represents a matrix where symbols denote categorical data (e.g., entities) and slashes indicate relationships or interactions. The top-row symbols with counts may act as headers or keys for interpreting the grid.
- **Relationships**: The slashes in the lower-right quadrant could signify dependencies or connections between the entities in those cells. The absence of symbols in these cells despite the slashes implies the relationships are abstract or secondary to the primary categorical data.
- **Anomalies**: The mismatch between top-row symbol counts (e.g., Ghost: `5` vs. 1 instance) and grid instances suggests the top-row numbers may represent weights, priorities, or external constraints rather than direct quantities. The bottom-row `2` in Column 1 might indicate a residual value or a constraint applied to that column.
This diagram appears to model a system where symbolic entities interact within a structured grid, with numerical annotations providing contextual metadata. Further analysis would require clarifying the purpose of the slashes and numerical labels.