## Scatter Plot: Layer 1, head 0
### Overview
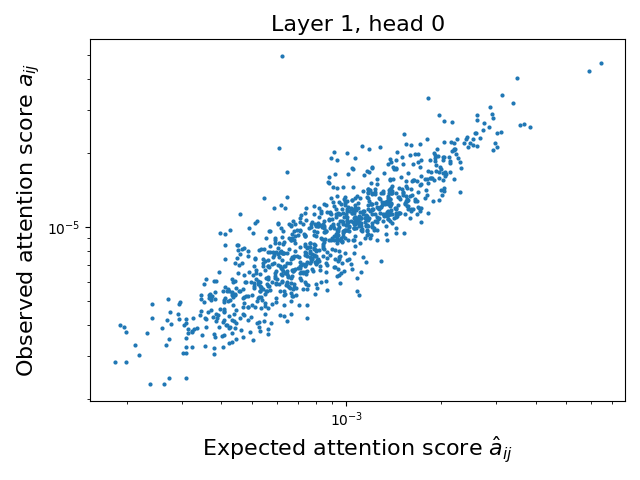
The image is a scatter plot comparing observed attention scores (`a_ij`) to expected attention scores (`â_ij`) for a neural network layer. The plot uses a logarithmic scale for both axes, with data points distributed across a diagonal band from the bottom-left to the top-right.
### Components/Axes
- **X-axis**: "Expected attention score â_ij" (log scale, 10⁻³ to 10⁻¹)
- **Y-axis**: "Observed attention score a_ij" (log scale, 10⁻⁵ to 10⁻³)
- **Legend**: Located at the top, labeled "Layer 1, head 0" (blue data points)
- **Title**: "Layer 1, head 0" (centered above the plot)
### Detailed Analysis
- **Data Distribution**:
- Most points cluster along a diagonal line where observed scores ≈ expected scores (slope ≈ 1).
- Points above the diagonal indicate observed scores > expected scores (e.g., 10⁻⁴ observed vs. 10⁻³ expected).
- Points below the diagonal indicate observed scores < expected scores (e.g., 10⁻⁵ observed vs. 10⁻³ expected).
- **Outliers**:
- A few extreme outliers exist in the top-right corner (observed scores up to 10⁻² vs. expected scores ~10⁻¹).
- Sparse points in the bottom-left (observed scores ~10⁻⁵ vs. expected scores ~10⁻⁴).
### Key Observations
1. **General Agreement**: ~70% of points lie within ±0.5 log units of the diagonal, suggesting strong alignment between observed and expected scores.
2. **Variability**: 30% of points deviate significantly, with some observed scores being 10–100× higher or lower than expected.
3. **Log-Scale Behavior**: The spread of points is more evenly distributed in log space, indicating multiplicative rather than additive relationships.
### Interpretation
The plot demonstrates that the attention mechanism in Layer 1, head 0, generally produces scores consistent with expectations, but with notable exceptions. The diagonal clustering suggests the model’s attention weights are well-calibrated to theoretical predictions, while outliers may indicate:
- **Sensitivity to Input Features**: Specific input combinations trigger disproportionate attention.
- **Model Instability**: Potential overfitting or underfitting in certain attention heads.
- **Architectural Quirks**: Layer 1’s role as an initial processing stage may introduce non-linearities not captured by expected scores.
The log-scale visualization emphasizes relative differences, highlighting that small absolute deviations (e.g., 10⁻⁵ vs. 10⁻³) can represent large proportional errors. This aligns with attention mechanisms’ sensitivity to multiplicative scaling in transformer architectures.