# Technical Document Extraction: Scatter Plot Analysis
## 1. Chart Overview
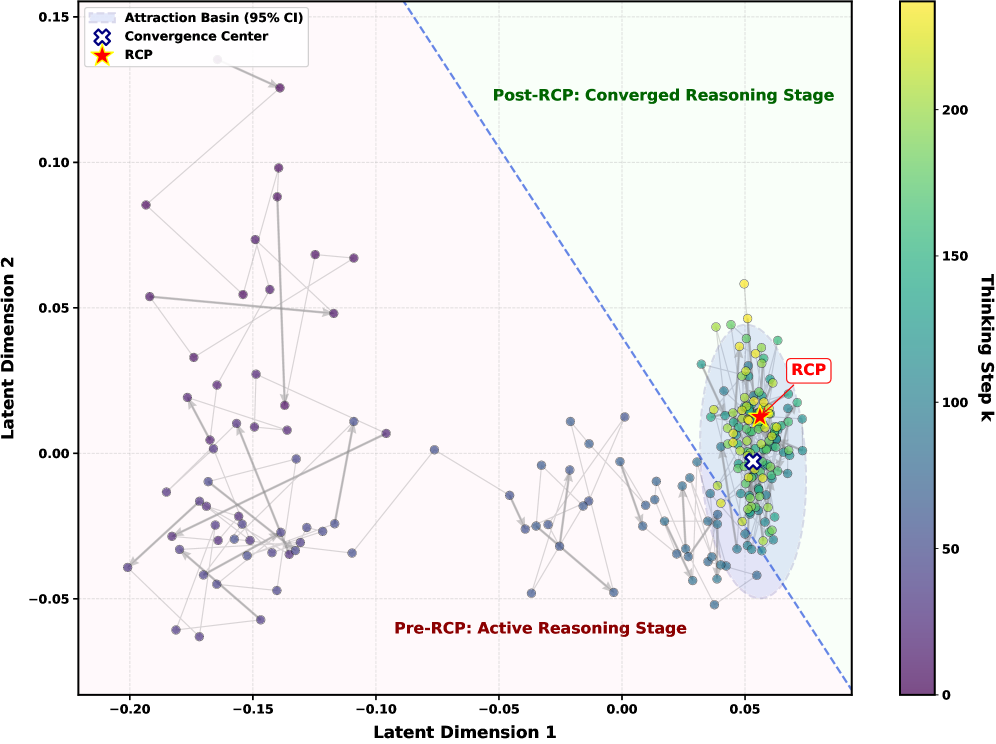
This image depicts a **scatter plot** visualizing latent space dynamics across two dimensions, with color-coded reasoning stages and convergence metrics. The plot is divided into two distinct regions by a dashed blue diagonal line.
---
## 2. Axes and Labels
- **X-axis**: *Latent Dimension 1*
- Range: -0.20 to 0.15
- Ticks: -0.20, -0.15, -0.10, -0.05, 0.00, 0.05, 0.10, 0.15
- **Y-axis**: *Latent Dimension 2*
- Range: -0.05 to 0.15
- Ticks: -0.05, 0.00, 0.05, 0.10, 0.15
---
## 3. Legend and Colorbar
- **Legend** (Top-left corner):
- **Attraction Basin (95% CI)**: Light purple (hex: #E6E6FA)
- **Convergence Center**: Dark blue (hex: #00008B) with a cross marker (✖)
- **RCP**: Red star (★)
- **Spatial Grounding**: Legend occupies coordinates [x=0.05, y=0.95] (normalized to plot bounds).
- **Colorbar** (Right side):
- **Title**: *Thinking Step k*
- **Gradient**: Purple (0) → Yellow (200)
- **Key Observation**: Higher *k* values (yellow) cluster in the Post-RCP region.
---
## 4. Data Points and Trends
### Pre-RCP Region (Left of dashed line)
- **Color**: Predominantly purple (low *k* values).
- **Trend**: Points are dispersed with no clear clustering.
- **Key Data Points**:
- Convergence Center: (-0.01, -0.01) ✖
- RCP: (-0.18, 0.07) ★
### Post-RCP Region (Right of dashed line)
- **Color**: Gradient from teal (100) to yellow (200).
- **Trend**: Dense clustering around the RCP point (0.02, 0.03) ★.
- **Attraction Basin (95% CI)**: Light purple shaded ellipse centered at (0.02, 0.03).
---
## 5. Annotations
- **Pre-RCP**: "Pre-RCP: Active Reasoning Stage" (Red text at [-0.15, -0.05]).
- **Post-RCP**: "Post-RCP: Converged Reasoning Stage" (Green text at [0.1, 0.1]).
---
## 6. Spatial Relationships
- The **dashed blue line** (y = -x) acts as a boundary between Pre-RCP and Post-RCP regions.
- The **RCP point** (0.02, 0.03) ★ lies at the intersection of the Attraction Basin and Post-RCP cluster.
- The **Convergence Center** (-0.01, -0.01) ✖ is isolated in the Pre-RCP region.
---
## 7. Validation Checks
- **Legend Consistency**:
- RCP ★ matches red star in legend.
- Convergence Center ✖ matches dark blue cross.
- **Colorbar Alignment**:
- Yellow points (k=200) align with the upper end of the colorbar.
- Purple points (k=0) align with the lower end.
---
## 8. Summary
The plot illustrates a transition from dispersed, low-*k* reasoning stages (Pre-RCP) to clustered, high-*k* convergent reasoning (Post-RCP), anchored by the RCP point. The Convergence Center marks a critical node in the latent space.