## Timing Diagram: Subarray Access Conflicts
### Overview
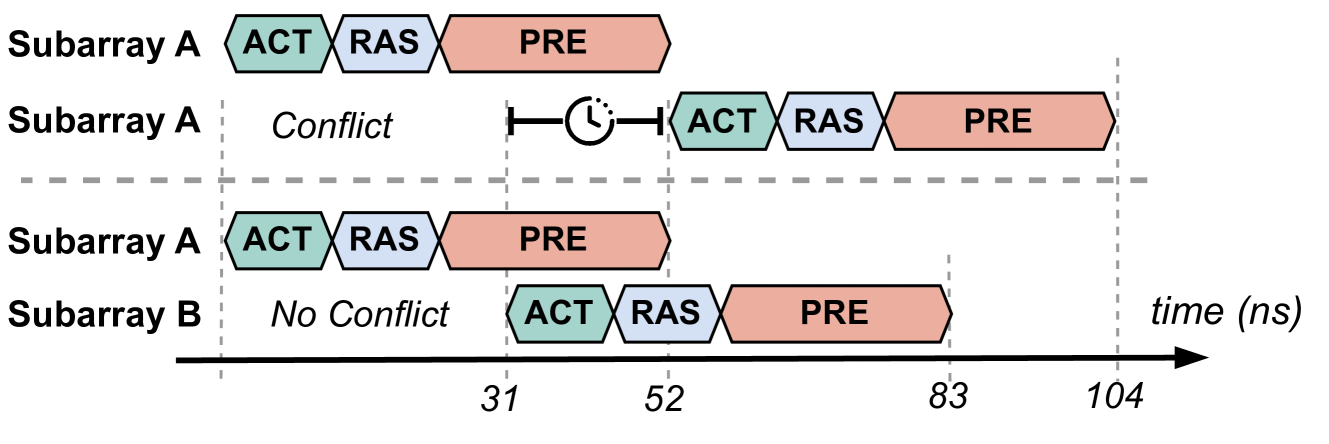
The image is a timing diagram illustrating potential access conflicts in memory subarrays. It shows the timing of three operations (ACT, RAS, PRE) for Subarray A and Subarray B, highlighting scenarios where conflicts occur and where they are avoided. The horizontal axis represents time in nanoseconds (ns).
### Components/Axes
* **Vertical Axis:** Represents different scenarios of subarray access.
* Subarray A (top)
* Subarray A (middle)
* Subarray A (bottom)
* Subarray B (bottom)
* **Horizontal Axis:** Represents time in nanoseconds (ns).
* Scale: 0 to 104 ns
* Markers: 31 ns, 52 ns, 83 ns, 104 ns
* **Operations:**
* ACT (Activate): Represented by a green-blue rounded rectangle.
* RAS (Row Address Strobe): Represented by a light blue rounded rectangle.
* PRE (Precharge): Represented by a light red rounded rectangle.
* **Conflict Indicators:**
* "Conflict": Text label indicating a conflict scenario.
* "No Conflict": Text label indicating a scenario without conflict.
* Clock symbol: Indicates a delay or waiting period.
### Detailed Analysis
* **Subarray A (Top):** Shows a sequence of ACT, RAS, and PRE operations without any conflict.
* ACT starts at approximately 0 ns and ends around 10 ns.
* RAS starts at approximately 10 ns and ends around 20 ns.
* PRE starts at approximately 20 ns and ends around 31 ns.
* **Subarray A (Middle):** Shows a conflict scenario.
* ACT, RAS, and PRE operations are initiated, but a conflict occurs, indicated by the "Conflict" label and a clock symbol.
* A delay is introduced before a second sequence of ACT, RAS, and PRE operations.
* The second ACT starts at approximately 52 ns.
* The second RAS starts at approximately 62 ns.
* The second PRE starts at approximately 72 ns and ends around 83 ns.
* **Subarray A (Bottom):** Shows a sequence of ACT, RAS, and PRE operations without any conflict.
* ACT starts at approximately 0 ns and ends around 10 ns.
* RAS starts at approximately 10 ns and ends around 20 ns.
* PRE starts at approximately 20 ns and ends around 31 ns.
* **Subarray B (Bottom):** Shows a sequence of ACT, RAS, and PRE operations that do not conflict with the operations of Subarray A.
* "No Conflict" label indicates the absence of conflict.
* ACT starts at approximately 31 ns and ends around 41 ns.
* RAS starts at approximately 41 ns and ends around 52 ns.
* PRE starts at approximately 62 ns and ends around 72 ns.
### Key Observations
* The diagram illustrates how timing overlaps between operations in different subarrays can lead to conflicts.
* The "Conflict" scenario introduces a delay, potentially impacting performance.
* Proper timing and scheduling of operations can avoid conflicts, as demonstrated by the "No Conflict" scenario.
### Interpretation
The timing diagram demonstrates the importance of managing access timing in memory systems to avoid conflicts between subarrays. Conflicts can lead to delays and reduced performance. The diagram highlights that careful scheduling and timing of operations are crucial for efficient memory access. The diagram shows that Subarray B's operations are offset in time from Subarray A's, preventing a conflict. The conflict in the second scenario for Subarray A is not fully explained by the diagram itself; it implies an external factor or dependency causing the delay.