# Technical Document Extraction: Subarray Timing Diagram
## Diagram Overview
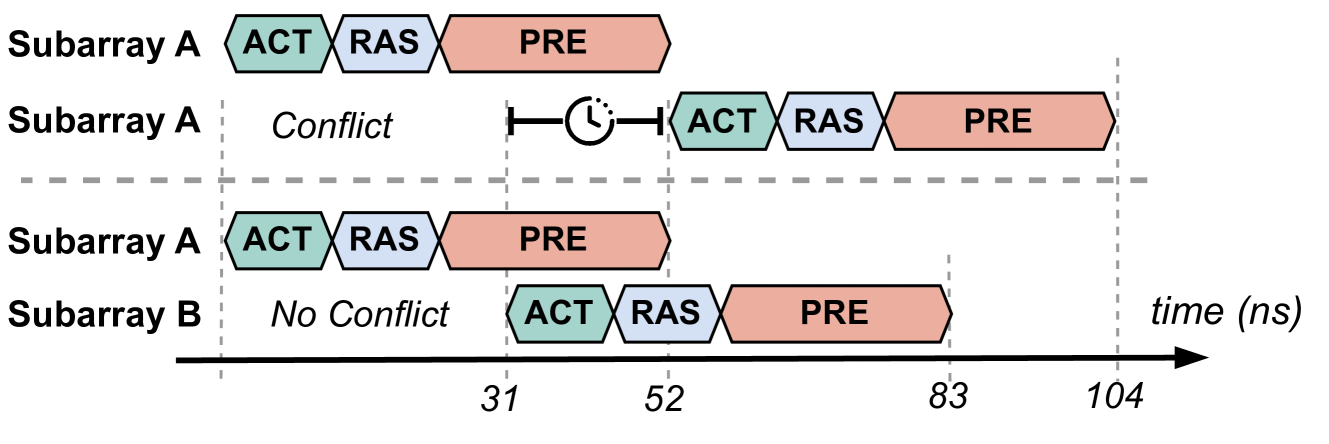
The image depicts a timing diagram comparing two subarrays (A and B) with three components: ACT (green), RAS (blue), and PRE (red). The x-axis represents time in nanoseconds (ns), and the y-axis distinguishes between Subarray A and Subarray B.
---
## Key Labels and Axis Markers
- **X-axis**:
- Title: `time (ns)`
- Markers: `31`, `52`, `83`, `104`
- **Y-axis**:
- Labels: `Subarray A` (top), `Subarray B` (bottom)
- **Legend**:
- Located at the top-right corner.
- Colors:
- Green: `ACT`
- Blue: `RAS`
- Red: `PRE`
---
## Component Flow and Conflict Analysis
### Subarray A
1. **Conflict Scenario**:
- Components `ACT` (31 ns), `RAS` (52 ns), and `PRE` (83 ns) overlap with a `PRE` component starting at 52 ns.
- Conflict is marked with a clock symbol between `52 ns` and `83 ns`.
- Visual overlap indicates timing incompatibility.
2. **Component Positions**:
- `ACT`: Starts at `31 ns`
- `RAS`: Starts at `52 ns`
- `PRE`: Starts at `83 ns`
### Subarray B
1. **No Conflict Scenario**:
- Components `ACT` (52 ns), `RAS` (83 ns), and `PRE` (104 ns) are spaced without overlap.
- Visual separation confirms no timing conflicts.
2. **Component Positions**:
- `ACT`: Starts at `52 ns`
- `RAS`: Starts at `83 ns`
- `PRE`: Starts at `104 ns`
---
## Trend Verification
- **Subarray A**:
- `ACT` and `RAS` components precede `PRE`, but their overlap with `PRE` creates a conflict.
- Time progression: `31 → 52 → 83 ns` with overlapping intervals.
- **Subarray B**:
- Components are sequentially spaced: `52 → 83 → 104 ns` with no overlap.
---
## Spatial Grounding
- **Legend Position**: Top-right corner (coordinates: `[x=900, y=50]` relative to diagram).
- **Conflict Marker**: Dashed line with clock symbol between `52 ns` and `83 ns` in Subarray A.
- **Component Colors**:
- Green (`ACT`) matches Subarray A’s first component.
- Blue (`RAS`) matches Subarray A’s second component.
- Red (`PRE`) matches Subarray A’s third component and Subarray B’s third component.
---
## Conclusion
The diagram illustrates timing conflicts in Subarray A due to overlapping components, while Subarray B avoids conflicts through sequential spacing. Critical time markers (`31`, `52`, `83`, `104 ns`) and component labels (`ACT`, `RAS`, `PRE`) are explicitly defined.