## Bar Chart: Model Performance Across Benchmarks
### Overview
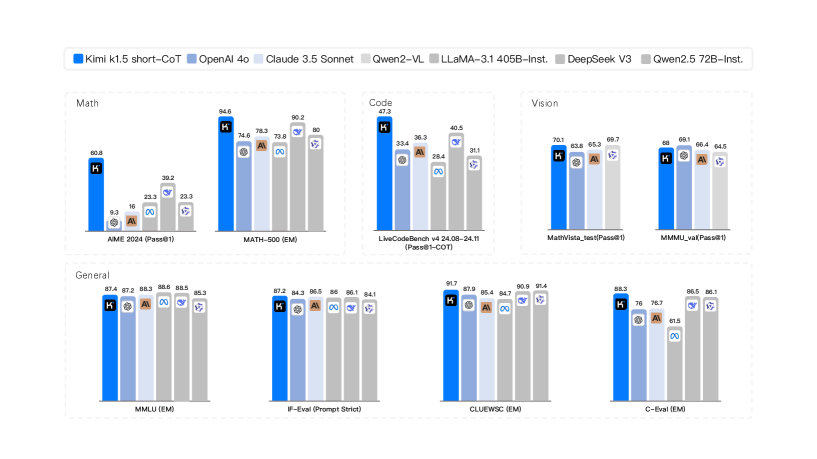
The image presents a series of bar charts comparing the performance of different language models across various benchmarks, including Math, Code, Vision, and General knowledge. The models being compared are Kimi k1.5 short-CoT, OpenAI 4o, Claude 3.5 Sonnet, Qwen2-VL, LLaMA-3.1 405B-Inst., DeepSeek V3, and Qwen2.5 72B-Inst. Each chart displays the performance (likely accuracy or a similar metric) of these models on a specific task.
### Components/Axes
* **X-axis:** Each chart represents a different benchmark or task. The specific tasks are:
* Math: AIME 2024 (Pass@1), MATH-500 (EM)
* Code: LiveCodeBench v4 24.08-24.11 (Pass@1-COT)
* Vision: MathVista\_test (Pass@1), MMMU\_val (Pass@1)
* General: MMLU (EM), IF-Eval (Prompt Strict), CLUEWSC (EM), C-Eval (EM)
* **Y-axis:** The y-axis represents the performance score, presumably accuracy or a similar metric, but the scale is not explicitly labeled.
* **Legend:** Located at the top of the image.
* Blue: Kimi k1.5 short-CoT
* Light Blue: OpenAI 4o
* Gray: Claude 3.5 Sonnet
* Light Gray: Qwen2-VL
* Dark Gray: LLaMA-3.1 405B-Inst.
* White: DeepSeek V3
* Lightest Gray: Qwen2.5 72B-Inst.
### Detailed Analysis
#### Math Benchmarks
* **AIME 2024 (Pass@1):**
* Kimi k1.5 short-CoT (Blue): 60.8
* OpenAI 4o (Light Blue): 9.3
* Claude 3.5 Sonnet (Gray): 16
* Qwen2-VL (Light Gray): 39.2
* LLaMA-3.1 405B-Inst. (Dark Gray): 23.3
* DeepSeek V3 (White): 23.3
* **MATH-500 (EM):**
* Kimi k1.5 short-CoT (Blue): 94.6
* OpenAI 4o (Light Blue): 74.6
* Claude 3.5 Sonnet (Gray): 78.3
* Qwen2-VL (Light Gray): 90.2
* LLaMA-3.1 405B-Inst. (Dark Gray): 73.8
* Qwen2.5 72B-Inst. (Lightest Gray): 80
#### Code Benchmark
* **LiveCodeBench v4 24.08-24.11 (Pass@1-COT):**
* Kimi k1.5 short-CoT (Blue): 47.3
* OpenAI 4o (Light Blue): 33.4
* Claude 3.5 Sonnet (Gray): 36.3
* Qwen2-VL (Light Gray): 40.5
* LLaMA-3.1 405B-Inst. (Dark Gray): 28.4
* Qwen2.5 72B-Inst. (Lightest Gray): 31.1
#### Vision Benchmarks
* **MathVista\_test (Pass@1):**
* Kimi k1.5 short-CoT (Blue): 70.1
* OpenAI 4o (Light Blue): 63.8
* Claude 3.5 Sonnet (Gray): 65.3
* Qwen2-VL (Light Gray): 69.7
* **MMMU\_val (Pass@1):**
* Kimi k1.5 short-CoT (Blue): 68
* OpenAI 4o (Light Blue): 66.1
* Claude 3.5 Sonnet (Gray): 66.4
* Qwen2-VL (Light Gray): 64.5
#### General Benchmarks
* **MMLU (EM):**
* Kimi k1.5 short-CoT (Blue): 87.4
* OpenAI 4o (Light Blue): 87.2
* Claude 3.5 Sonnet (Gray): 88.3
* Qwen2-VL (Light Gray): 88.6
* LLaMA-3.1 405B-Inst. (Dark Gray): 88.5
* Qwen2.5 72B-Inst. (Lightest Gray): 85.3
* **IF-Eval (Prompt Strict):**
* Kimi k1.5 short-CoT (Blue): 87.2
* OpenAI 4o (Light Blue): 84.3
* Claude 3.5 Sonnet (Gray): 86.5
* Qwen2-VL (Light Gray): 86
* LLaMA-3.1 405B-Inst. (Dark Gray): 86.1
* Qwen2.5 72B-Inst. (Lightest Gray): 84.1
* **CLUEWSC (EM):**
* Kimi k1.5 short-CoT (Blue): 91.7
* OpenAI 4o (Light Blue): 87.9
* Claude 3.5 Sonnet (Gray): 85.4
* Qwen2-VL (Light Gray): 90.9
* LLaMA-3.1 405B-Inst. (Dark Gray): 84.7
* Qwen2.5 72B-Inst. (Lightest Gray): 91.4
* **C-Eval (EM):**
* Kimi k1.5 short-CoT (Blue): 88.3
* OpenAI 4o (Light Blue): 76
* Claude 3.5 Sonnet (Gray): 76.7
* LLaMA-3.1 405B-Inst. (Dark Gray): 61.5
* Qwen2.5 72B-Inst. (Lightest Gray): 86.1
### Key Observations
* Kimi k1.5 short-CoT generally performs well across all benchmarks, often achieving the highest scores.
* OpenAI 4o shows variable performance, with lower scores on AIME 2024 and C-Eval compared to other benchmarks.
* The performance of LLaMA-3.1 405B-Inst. is generally lower than Kimi k1.5 short-CoT and Qwen2-VL.
* The models show relatively consistent performance on the General benchmarks, with scores generally above 80.
### Interpretation
The data suggests that Kimi k1.5 short-CoT is a strong performer across a variety of tasks, including math, code, vision, and general knowledge. The performance differences between the models highlight their strengths and weaknesses in different areas. For example, OpenAI 4o seems to struggle with the AIME 2024 math problem set compared to other models. The consistent performance on the General benchmarks suggests that these models have a good grasp of general knowledge tasks. The relatively lower performance of LLaMA-3.1 405B-Inst. may be due to its architecture or training data.