## Heatmap: Radial Distribution
### Overview
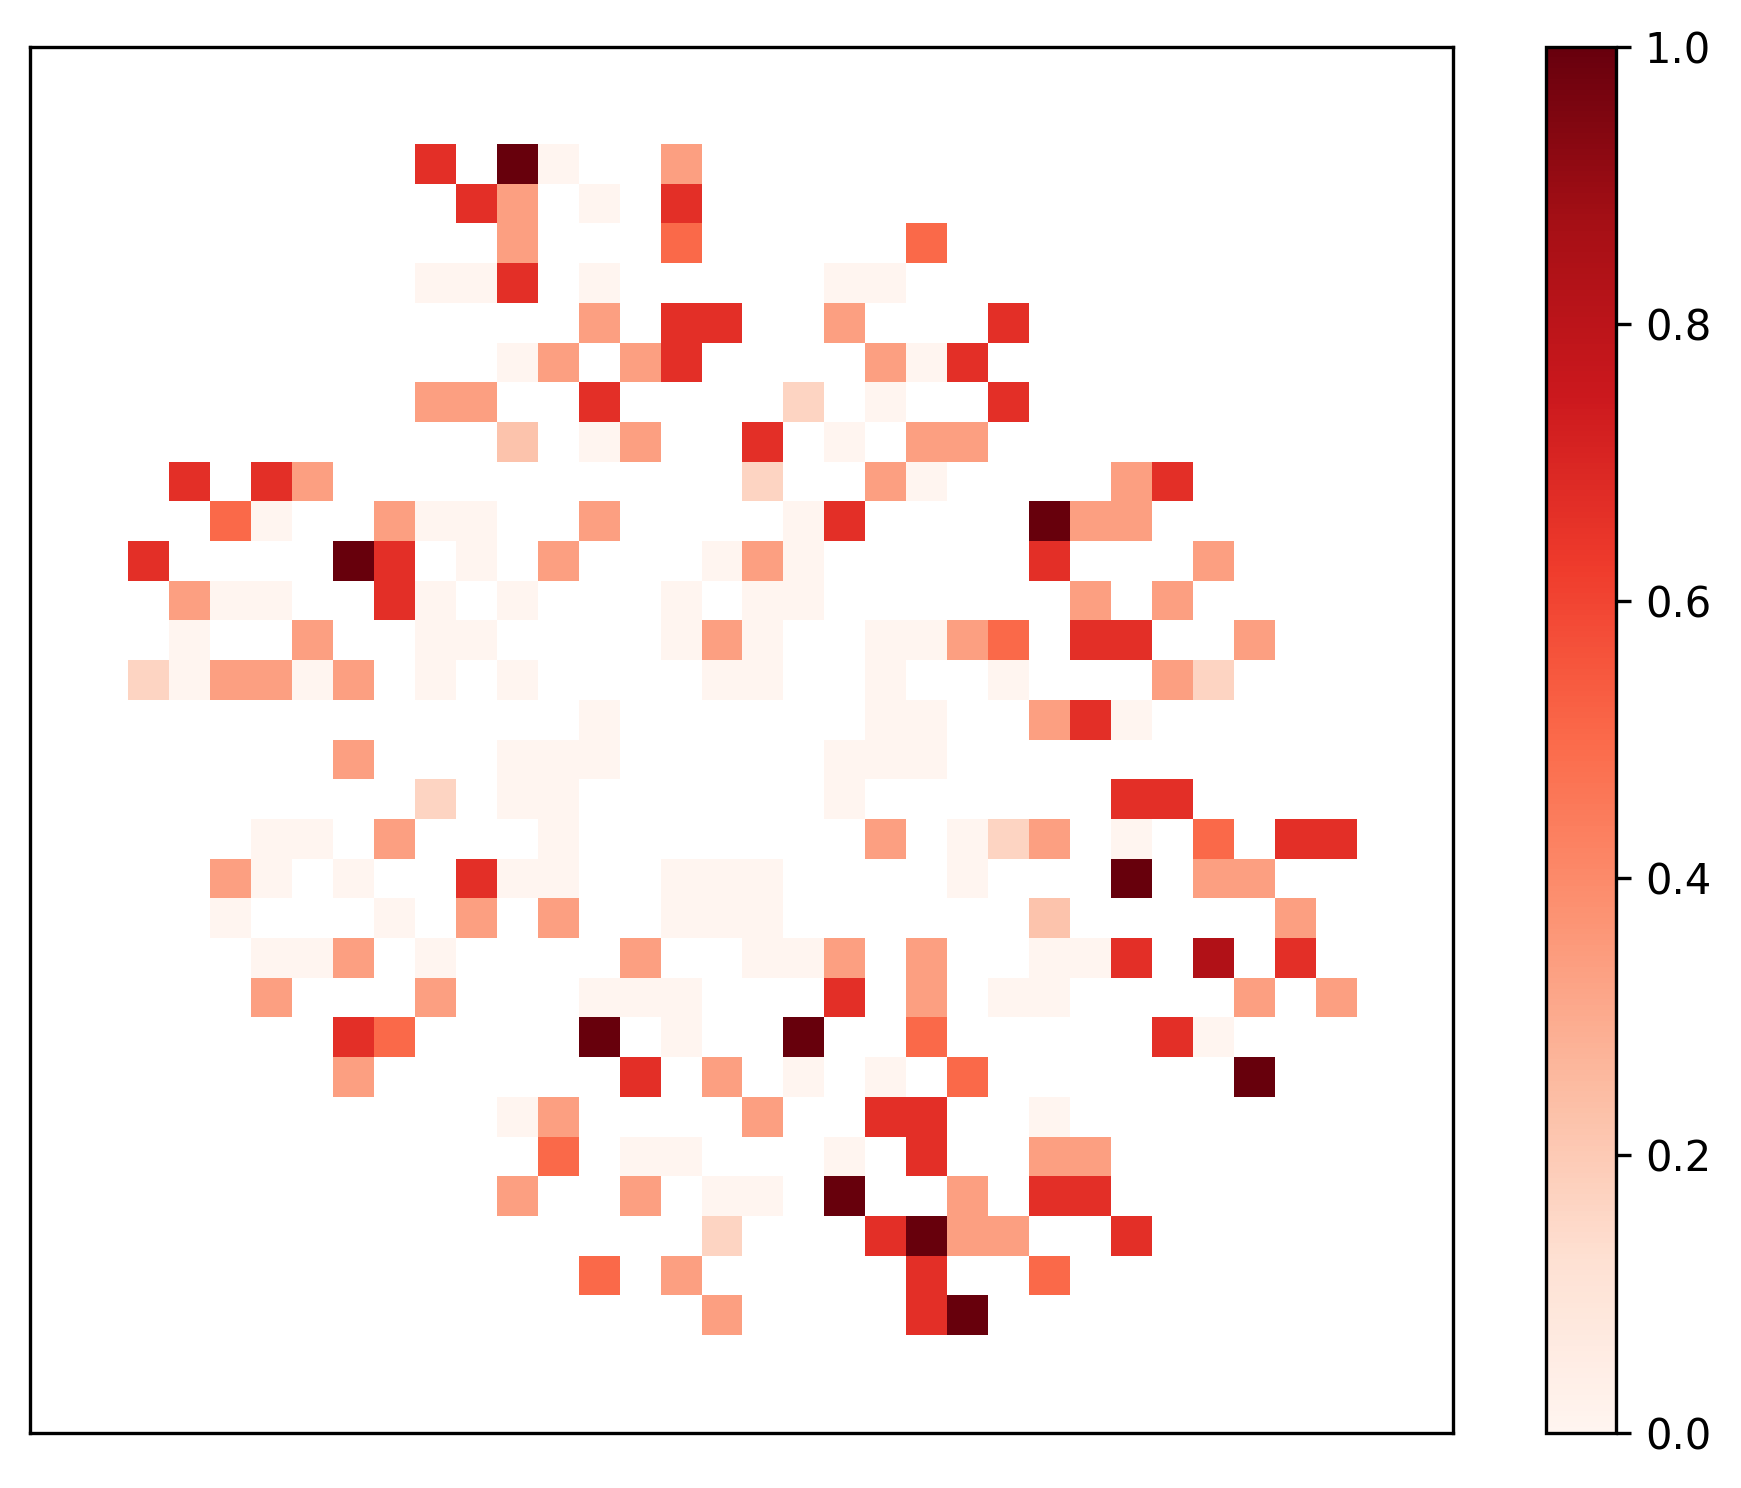
The image is a heatmap displaying a radial distribution pattern. The data is represented by colored squares, with the intensity of the red color indicating the magnitude of the value. The distribution appears to be concentrated in certain radial directions, forming a somewhat flower-like shape.
### Components/Axes
* **X and Y Axes:** The X and Y axes are not explicitly labeled, but they represent a 2D spatial grid.
* **Color Scale (Legend):** Located on the right side of the image.
* The color scale ranges from white to dark red.
* White corresponds to a value of 0.0.
* Dark red corresponds to a value of 1.0.
* Intermediate values are represented by shades of red, with 0.2, 0.4, 0.6, and 0.8 marked on the scale.
### Detailed Analysis
The heatmap consists of a grid of squares, each colored according to its value. The values are distributed in a radial pattern, with higher values (darker red) concentrated in certain directions.
* **Radial Distribution:** The distribution is not uniform. There are areas of high concentration (dark red) and areas of low concentration (white or light red).
* **Concentration Areas:** There are approximately four main areas of concentration, forming a somewhat flower-like shape. These areas are located roughly at the "corners" of the image.
* **Value Range:** The values range from approximately 0.0 (white) to 1.0 (dark red).
* **Specific Data Points:**
* Several squares have values close to 1.0 (dark red). These are scattered throughout the concentration areas.
* Many squares have values close to 0.0 (white), particularly in the areas between the concentration areas.
* The remaining squares have intermediate values, ranging from light red to medium red.
### Key Observations
* The data is not uniformly distributed.
* There are distinct areas of high concentration.
* The distribution has a radial pattern.
### Interpretation
The heatmap visualizes a radial distribution of data, where the intensity of the red color represents the magnitude of the value. The pattern suggests that the underlying phenomenon being represented is concentrated in certain radial directions, forming a somewhat flower-like shape. The areas of high concentration (dark red) indicate regions where the phenomenon is most prominent, while the areas of low concentration (white) indicate regions where it is less prominent. The specific meaning of this distribution would depend on the context of the data.