## Line Chart: CPU Time vs. Number of Parameters for 512 Tokens
### Overview
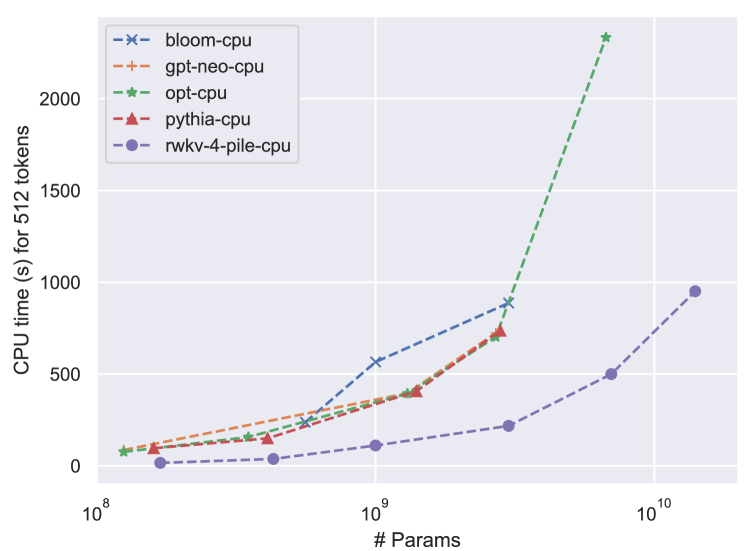
The chart compares the CPU time (in seconds) required to process 512 tokens across five different systems as the number of parameters increases from 10⁸ to 10¹⁰. The y-axis represents CPU time, and the x-axis represents the number of parameters on a logarithmic scale. Five systems are compared: bloom-cpu, gpt-neo-cpu, opt-cpu, pythia-cpu, and rwkv-4-pile-cpu.
### Components/Axes
- **X-axis**: "# Params" (logarithmic scale: 10⁸, 10⁹, 10¹⁰)
- **Y-axis**: "CPU time (s) for 512 tokens" (linear scale: 0 to 2000)
- **Legend**: Located in the top-left corner, with line styles and colors:
- **bloom-cpu**: Blue dashed line with "×" markers
- **gpt-neo-cpu**: Orange dash-dot line with "+" markers
- **opt-cpu**: Green dash-dot line with "★" markers
- **pythia-cpu**: Red dashed line with "▲" markers
- **rwkv-4-pile-cpu**: Purple dash-dot line with "●" markers
### Detailed Analysis
1. **bloom-cpu** (blue): Starts at ~50s for 10⁸ params, rises to ~500s at 10⁹, and ~800s at 10¹⁰.
2. **gpt-neo-cpu** (orange): Begins at ~50s for 10⁸, increases to ~400s at 10⁹, and ~700s at 10¹⁰.
3. **opt-cpu** (green): Starts at ~50s for 10⁸, rises sharply to ~400s at 10⁹, and explodes to ~2200s at 10¹⁰.
4. **pythia-cpu** (red): Starts at ~50s for 10⁸, increases to ~350s at 10⁹, and ~700s at 10¹⁰.
5. **rwkv-4-pile-cpu** (purple): Remains flat at ~10s for 10⁸ and 10⁹, then jumps to ~900s at 10¹⁰.
### Key Observations
- **opt-cpu** exhibits the steepest growth, with CPU time increasing **5.5x** between 10⁹ and 10¹⁰ parameters.
- **rwkv-4-pile-cpu** maintains the lowest CPU time until 10¹⁰, where it suddenly spikes.
- All systems except rwkv-4-pile-cpu show gradual increases between 10⁸ and 10⁹ parameters.
- At 10¹⁰ parameters, opt-cpu's CPU time surpasses all others by a factor of ~3x.
### Interpretation
The data suggests that **opt-cpu** scales poorly with increasing model size, making it impractical for large parameter counts. In contrast, **rwkv-4-pile-cpu** demonstrates superior efficiency across most parameter ranges, though its performance degrades dramatically at 10¹⁰ parameters. The divergence in trends highlights trade-offs between system design and scalability. The sudden spike in rwkv-4-pile-cpu at 10¹⁰ params may indicate an architectural limitation or optimization threshold. These results emphasize the importance of selecting hardware/software configurations aligned with the target model size.