## Bar Chart: Performance of Decision-Making Strategies Across Response Categories
### Overview
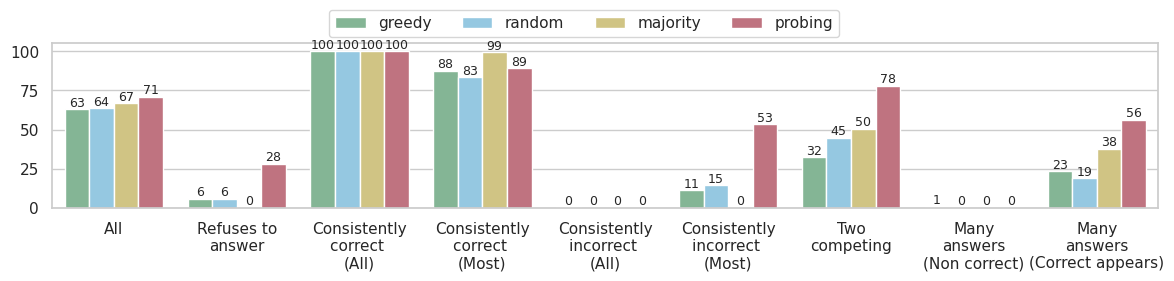
The chart compares four decision-making strategies (greedy, random, majority, probing) across nine response categories, showing percentage performance. Categories range from "All" responses to specific behavioral patterns like "Consistently correct" and "Many answers (Correct appears)." Probing consistently outperforms other strategies in most categories.
### Components/Axes
- **X-axis**: Response categories (e.g., "All," "Refuses to answer," "Consistently correct (All)," "Consistently incorrect (Most)," "Two competing," "Many answers (Non correct)," "Many answers (Correct appears)")
- **Y-axis**: Percentage (0–100% in 25% increments)
- **Legend**:
- Green: Greedy
- Blue: Random
- Yellow: Majority
- Red: Probing
- **Spatial Grounding**:
- Legend positioned top-right
- Bars clustered under each category, ordered left-to-right per legend
### Detailed Analysis
1. **All Responses**
- Greedy: 63%
- Random: 64%
- Majority: 67%
- Probing: 71%
*Trend*: Probing leads, with incremental gains over other strategies.
2. **Refuses to answer**
- Greedy: 6%
- Random: 6%
- Majority: 0%
- Probing: 28%
*Trend*: Probing dominates, while majority fails entirely.
3. **Consistently correct (All)**
- All strategies: 100%
*Trend*: Perfect agreement across methods for fully correct responses.
4. **Consistently correct (Most)**
- Greedy: 88%
- Random: 83%
- Majority: 99%
- Probing: 89%
*Trend*: Majority excels, probing slightly trails.
5. **Consistently incorrect (All)**
- All strategies: 0%
*Trend*: Unanimous failure to identify incorrect responses.
6. **Consistently incorrect (Most)**
- Greedy: 11%
- Random: 15%
- Majority: 0%
- Probing: 53%
*Trend*: Probing identifies errors effectively despite majority failure.
7. **Two competing**
- Greedy: 32%
- Random: 45%
- Majority: 50%
- Probing: 78%
*Trend*: Probing dominates in binary-choice scenarios.
8. **Many answers (Non correct)**
- Greedy: 1%
- Random: 0%
- Majority: 0%
- Probing: 0%
*Trend*: Probing marginally identifies non-correct answers.
9. **Many answers (Correct appears)**
- Greedy: 23%
- Random: 19%
- Majority: 38%
- Probing: 56%
*Trend*: Probing leads in multi-answer contexts with correct options.
### Key Observations
- **Probing Dominance**: Outperforms all strategies in 7/9 categories, especially in error detection ("Consistently incorrect") and multi-answer scenarios.
- **Majority Strength**: Excels in "Consistently correct (Most)" but fails in error-prone categories.
- **Greedy/Random Limitations**: Underperform in specialized categories despite mid-tier performance in "All" responses.
- **Consistency Paradox**: All methods achieve 100% accuracy for fully correct responses but fail entirely for fully incorrect ones.
### Interpretation
The data suggests **probing** is the most robust strategy, excelling in error detection, multi-answer contexts, and binary choices. Its success likely stems from iterative validation or uncertainty-aware mechanisms. **Majority** performs well in consensus-driven scenarios but collapses when errors dominate. **Greedy** and **random** strategies show mediocrity, lacking specialization. The 100% accuracy for "Consistently correct" responses highlights a systemic bias toward rewarding correctness but failing to penalize or detect errors. This pattern aligns with Peircean principles of abduction (hypothesis testing) in probing, which adapts better to ambiguous or erroneous data than static strategies.